A school exits Comprehensive Support and Improvement (CSI) status by achieving sustained academic growth over two consecutive years and meeting state-defined accountability targets.
This requires a rigorous Root Cause Analysis (RCA) driven by high-frequency, classroom-level data rather than lagging annual test scores.
This guide explores why schools struggle to exit, the ESSA requirements for improvement, and a four-part data model for sustainable success.
Key Takeaways
- CSI schools cannot realistically exit status by the 2027–2028 accountability cycle without a precise root-cause analysis that relies on frequent, aggregated classroom-level data—not just annual test scores and schoolwide averages.
- ESSA requires CSI schools to conduct a Root Cause Analysis (RCA), yet most districts still rely on lagging indicators that obscure substantial within-school variation in instructional quality.
- Research from low-performing schools in Massachusetts (2016–2018) reveals that more than 40% of schools exhibit large differences in instructional quality across classrooms; without classroom-level data, leaders misdiagnose systemic problems as schoolwide issues.
- Districts managing portfolios of CSI schools need a standardized classroom data model—6–10 observations per teacher per year, plus 3–5 formative assessment cycles—to identify and monitor true root causes.
- Districts that combine rigorous RCA with high-frequency classroom data are more likely to meet exit criteria (two consecutive years of improvement) and avoid more intrusive state interventions, such as mandated partners or takeover.
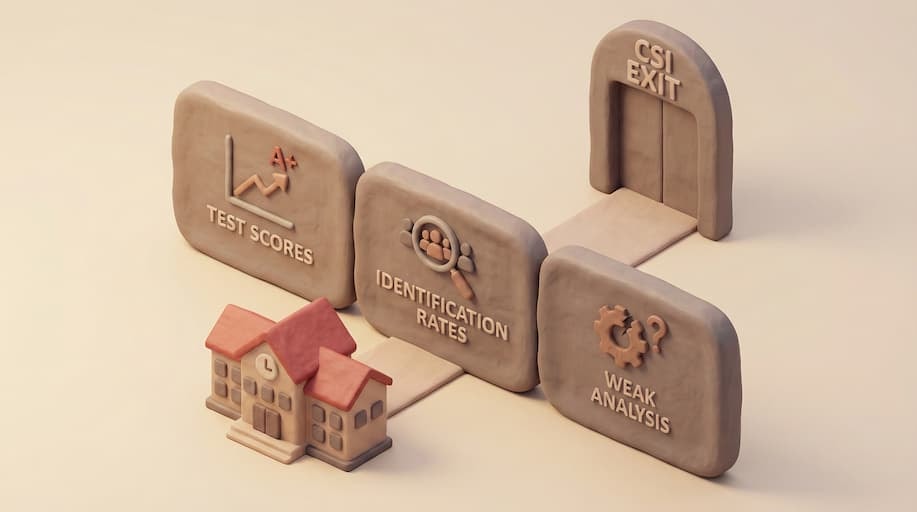
Why Do Most Schools Struggle to Exit CSI Status?
Schools designated under the Comprehensive Support and Improvement (CSI) program face significant pressure to improve.
But for many, getting off the list is much harder than getting on it. Even with funding, improvement plans, and urgency, some of the lowest performing schools remain identified for years.
So why is this happening?
Test Scores Show Where There’s a Problem, Not Why It Happened
Lagging test scores identify performance gaps but fail to diagnose the specific instructional failures causing them.
According to a 2025 Institute of Education Sciences (IES) study, while the Every Student Succeeds Act (ESSA) has flagged fewer schools overall than previous laws, those identified often lack the granular diagnostic data needed for reform.
Furthermore, the National Center for the Improvement of Educational Assessment (NCIEA) warns that exit criteria in many states are mathematically stricter than entry requirements.
Because school leaders make decisions based on delayed evidence, they often apply schoolwide professional development to problems that are actually localized within specific classrooms, preventing the growth needed to meet these strict exit targets.
More Schools Are Being Identified, But Few Are Exiting
The challenge is not just who is added to the CSI list. It’s how difficult it is to be removed from the list.
According to a 2021 Wing Institute report, states vary wildly in their identification of low-performing schools under the Every Student Succeeds Act (ESSA), with some states labeling 40% of schools as CSI while others identify fewer than 10%.
For example, Wisconsin’s timeline shows that schools identified in the 2022–23 school year may not be eligible to exit until at least 2025–26. The only exception is if they perform far better than the state’s improvement targets. Until then, those schools remain labeled as failing, even if they are working hard.
A report from the National Center for the Improvement of Educational Assessment (NCIEA) warns that in some states, the rules for exiting the CSI list are stricter than those for entering it. That causes more schools to stay stuck in CSI status year after year.
Weak Root Cause Analysis Leads to the Wrong Fixes
Every CSI school is expected to conduct a Root Cause Analysis (RCA) to identify the causes of poor results. But in most states, this step is weak or missing.
Schools often rely on general surveys or assumptions rather than on real classroom data. For example, a school might state that the problem is “low parent engagement” or “students are not motivated” without providing clear evidence.
A 2019 CCSSO report found that 61% of states made major progress in supporting local needs assessments and data use for school improvement plans, but many still prioritize paperwork and processes like CSI plan approvals over evidence-based strategies. This leads to superficial actions such as general teacher training or one-time family events, which monitoring gaps show rarely sustain student learning gains.
A parallel 2020 systematic review of 21 RCA studies (n=20-1,707 analyses) confirms 50% produce weak recommendations focused on active errors rather than systemic fixes, mirroring school plan shortcomings
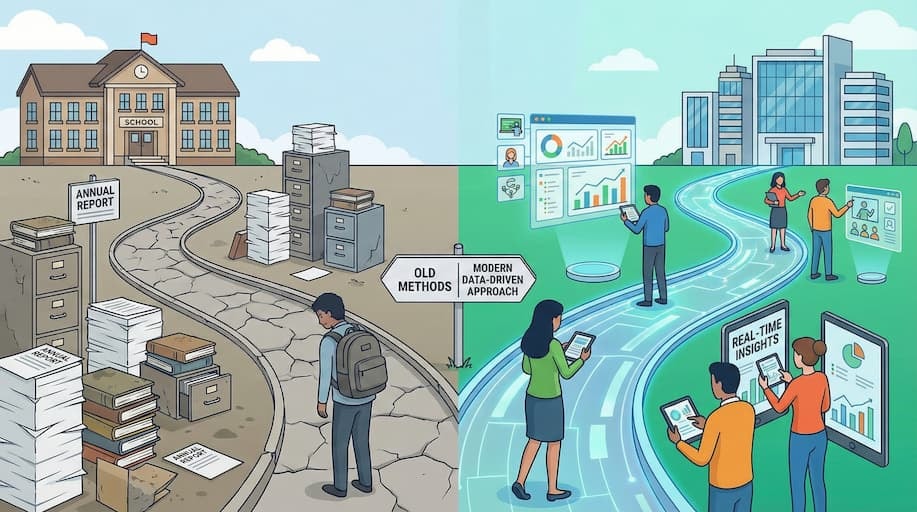
What’s Missing: Daily Insight from the Classroom
To meet exit criteria under the Student Succeeds Act and improve both academic growth and school quality, schools need more than end-of-year test scores. They need real-time insight into what’s happening during instruction, every day.
This level of visibility is especially critical in high school settings, where students must accumulate sufficient academic credits to graduate on time. It’s also essential in elementary and middle schools, where foundational skills are built.
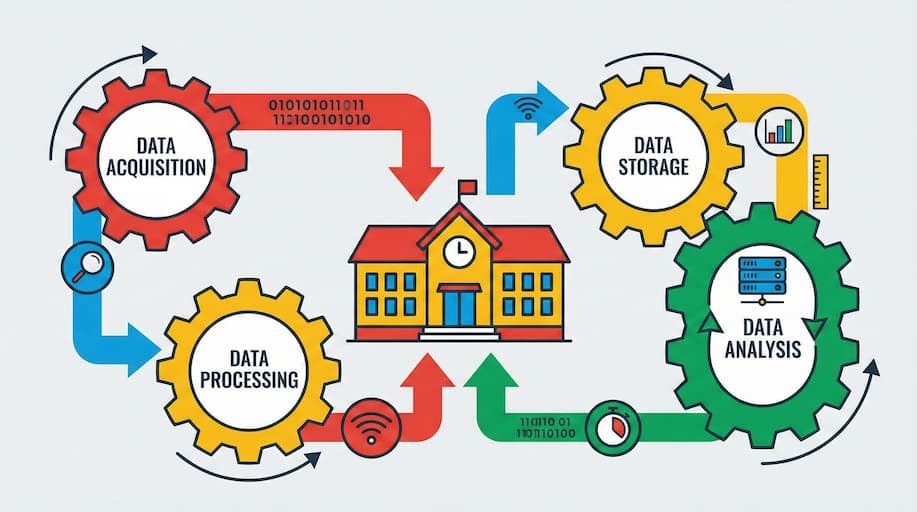
Implementing a daily instructional data system allows administrators to monitor several key success factors:
- Curriculum Fidelity: Verifying that teachers are utilizing the core curriculum consistently across all grade levels.
- Subgroup Support: Ensuring student groups under the Individuals with Disabilities Education Act (IDEA) receive mandated instructional accommodations.
- Standard Alignment: Confirming that classroom assignments match the rigor of challenging state academic standards.
- Intervention Quality: Tracking the delivery and effectiveness of small-group tutoring and alternate academic achievement standards.
These answers don’t come from annual assessments alone. They require regular classroom observations, formative assessments, and quick progress checks.
Without this kind of data, even well-intentioned plans risk missing what matters most. Many comprehensive support schools continue submitting documents that satisfy the state’s accountability system, yet fail to improve student achievement or outcomes for particularly students who need help the most.
To truly improve under the statewide accountability system, schools must look beyond compliance and into classrooms, where the real work of learning happens.

ESSA Requirements vs. Reality on the Ground
ESSA sets clear rules for how states must identify struggling schools. However, in practice, many school districts find that the process does not proceed as smoothly as intended.
What the Law Says vs. What Actually Happens
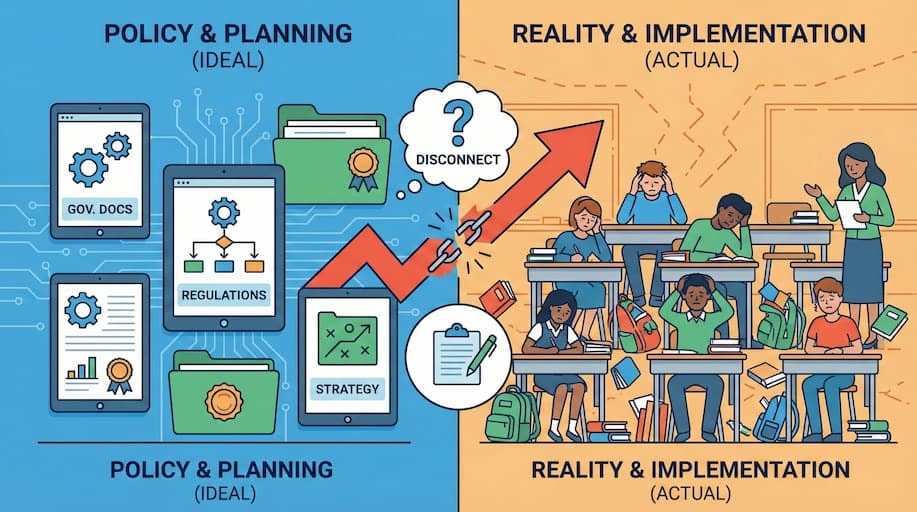
ESSA sets clear expectations for identifying and supporting the lowest-performing schools, but the reality often differs at the school level. Below is a side-by-side comparison of what the state plans require and what many school leaders actually experience:
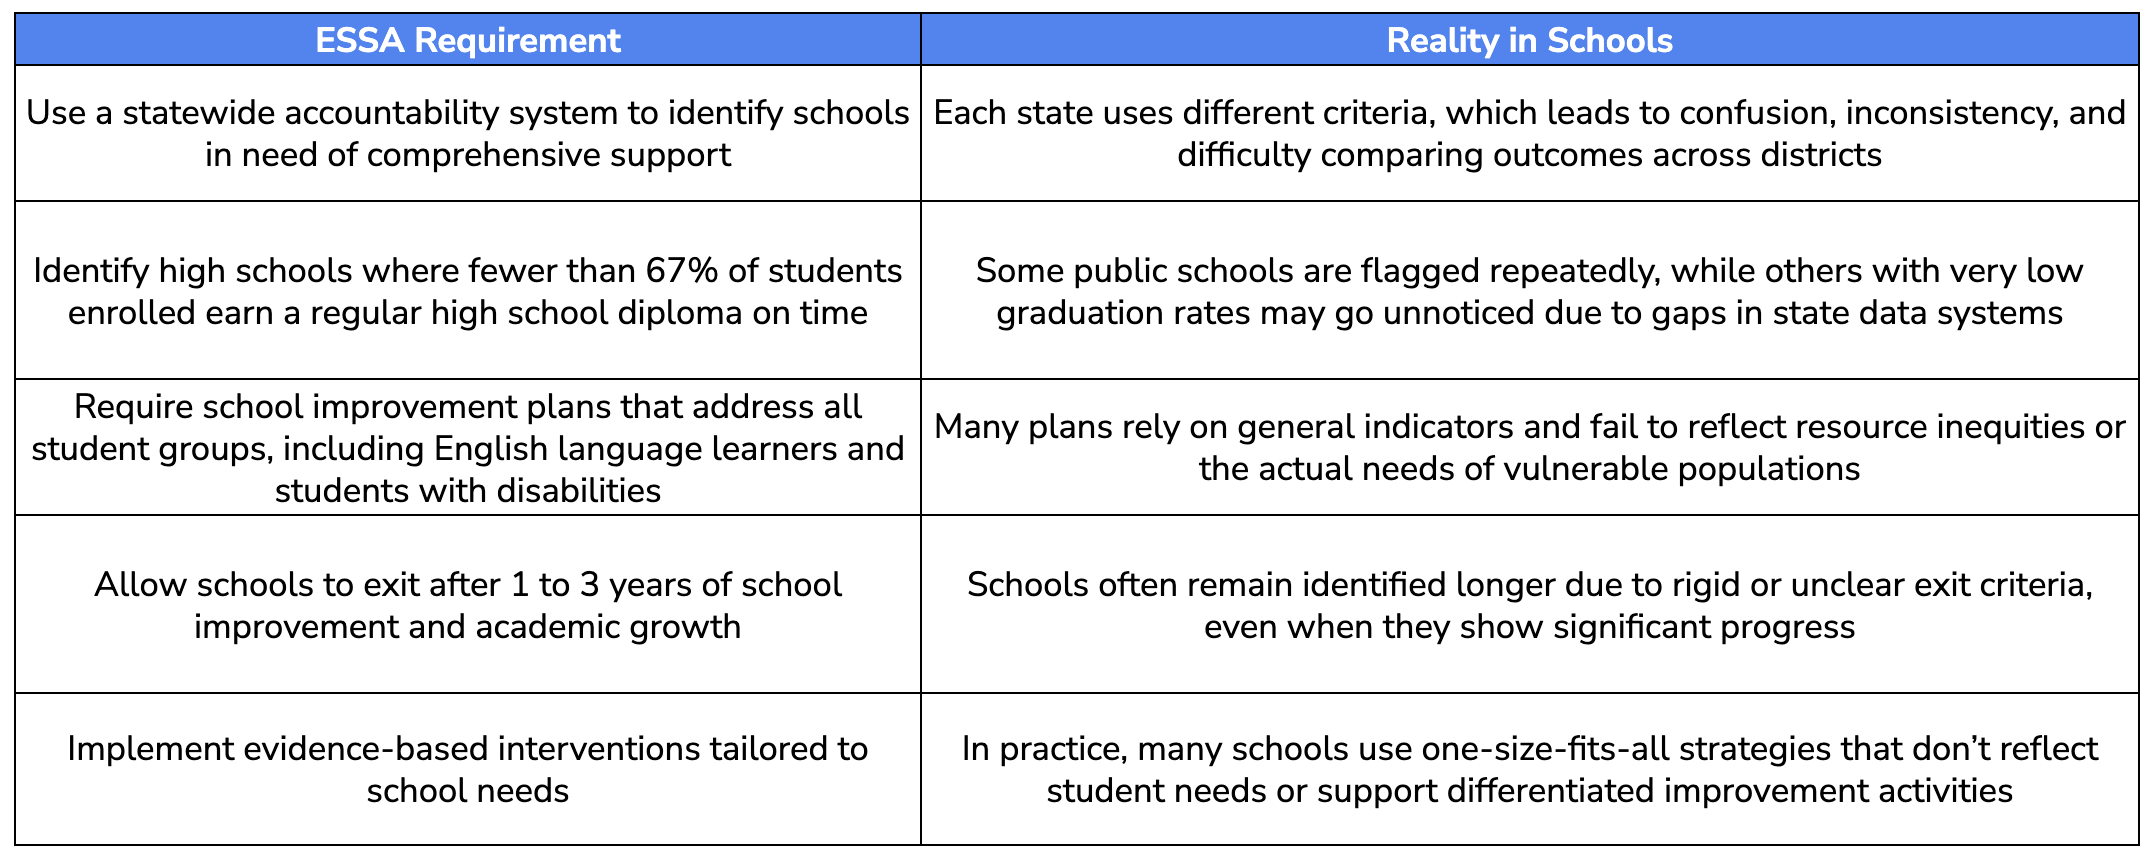
In some cases, community members and educators feel discouraged when schools are re-identified before they’ve had time to improve. This is especially difficult for schools serving low-income families or students pursuing postsecondary education through alternative pathways. Without space to show academic performance gains or flexibility in timelines, the path forward is unclear.
Clearer expectations, better data, and tailored supports, not just compliance, are essential for real, lasting improvement.
Why RCA Breaks Down
- Too general: Many plans cite causes such as “low expectations” or “weak engagement” without evidence from classrooms.
- Limited data: Schools rely on summary test scores rather than on direct observation of instruction.
- One-size-fits-all templates: Some school districts reuse forms and answers, even when each school faces different challenges.
When RCAs are built on assumptions rather than data, the fixes rarely address the problem. For example, professional development may be offered to all staff, even if only a few classrooms need support.
This affects the entire school community, especially student groups who depend on consistent instruction. Students with significant cognitive disabilities or those supported under the Individuals with Disabilities Education Act are most at risk when schools don’t have clear insight into instruction.
To create stronger school improvement plans, schools need to see what is happening day by day, not just respond to last year’s scores.
Instruction Is the Root Cause, But You Need to See It
Many struggling schools try to improve by changing policies, adding programs, or offering more support. These are important steps, but they often miss the core issue: classroom instruction.
Real Change Starts in the Classroom
A 2025 Massachusetts Department of Elementary and Secondary Education study found that 43% of low-performing schools exhibit high variation in instructional quality between classrooms, proving that schoolwide averages mask critical localized failures.
Some teachers are using grade-level materials and engaging students in rigorous work. Others are using low-level worksheets or focusing only on basic recall.
But school ratings only reflect overall averages. Without classroom-level data, school leaders cannot identify where strong teaching is occurring and where support is needed.
This is most important for student groups that already face learning gaps. Students with the most significant cognitive disabilities, or those working with alternate academic achievement standards, rely heavily on clear instruction and consistent support. When quality varies across classrooms, these students lose out.
To make real progress, schools need to look at:
- What teaching looks like in every classroom
- Whether the challenging academic standards are being taught consistently
- Which students are receiving effective support
- How instruction connects to actual student learning
When schools identify these patterns, they can focus coaching, adjust supports, and improve outcomes in ways testing data alone cannot reveal.
A Practical Data Model That Helps Schools Improve (and Exit CSI)
Most school improvement plans rely on delayed test scores, compliance paperwork, or general strategies that don’t reach the classroom. However, for schools seeking to exit CSI status, such a data system is insufficient.
The real difference lies in how schools use data to support instruction each week. Leaders in successful districts focus on real-time information, not just reports that arrive after the school year ends.
What Most Schools Use vs. What Actually Works
Here’s a quick comparison of what most schools currently use versus what high-impact schools actually need:
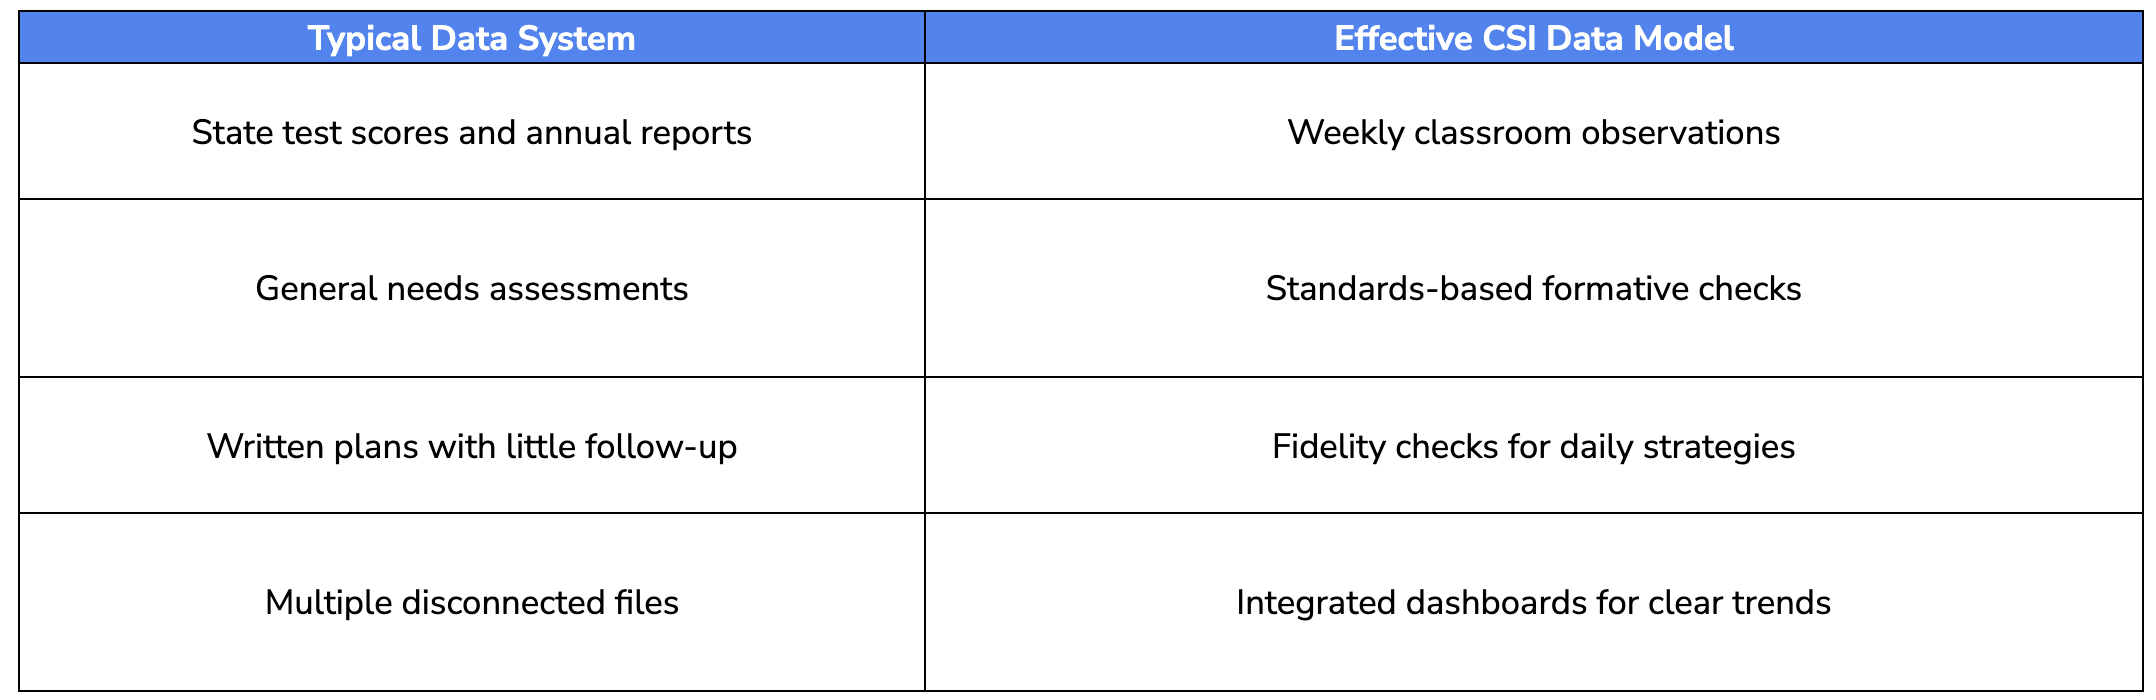
Many schools check boxes and track averages. But schools that improve student outcomes collect the right data at the right time and use it to guide instruction.
The 4-Part Model That Helps Schools Exit CSI
This model is designed to be simple, actionable, and grounded in daily instruction. It supports school-level efforts while meeting accountability goals.
1. Classroom Observations
School leaders regularly visit classrooms to see instruction in action.
- Short, focused visits (about 20 minutes)
- One clear action step is shared after each visit
- Helps identify whether the core curriculum is used consistently
This provides leaders and coaches with a weekly view of student learning, rather than an annual one.
2. Formative Assessments
Frequent, short assessments aligned to standards.
- Done every few weeks in reading, math, and key subjects
- Helps track student growth before high-stakes exams
- Guides real-time changes in instruction
This is particularly helpful in middle and high schools, where timing is critical.
3. Fidelity Checks
Tracks whether support strategies are being used as intended.
- Are students with significant cognitive disabilities receiving targeted instruction?
- Are small groups happening regularly?
- Are academic interventions being delivered with quality?
Many school improvement plans sound strong on paper. Fidelity checks help ensure that those plans are being implemented.
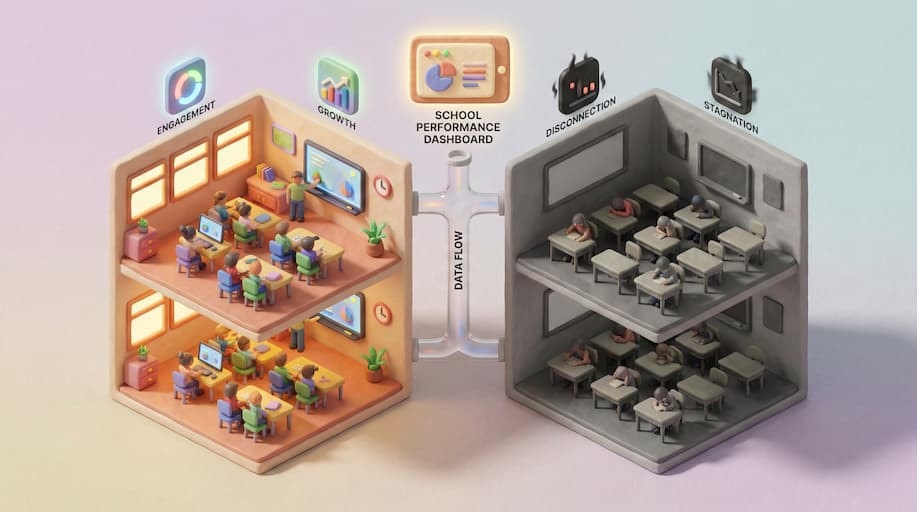
4. Integrated Dashboards
Synthesize all this data into a single view for school leaders.
- Combines observations, assessment results, and implementation data
- Filters by student groups, grade levels, and subject areas
- Helps districts align efforts with the state’s accountability system
Leaders can track school improvement progress without waiting for end-of-year test results.
Education Walkthrough Makes This Easier
Schools using this model often turn to Education Walkthrough to manage classroom data in a single location.
- Mobile walkthrough tools for quick observations
- Customizable rubrics and shared templates
- Immediate feedback and reports for coaching
- Integrated dashboards for school and district leaders
It helps school leaders remain focused on instruction rather than paperwork. It provides districts with a clear view of student performance across all schools.
See how Education Walkthrough Supports School Improvement Efforts
What Happens When Districts Actually Use the Data
What happens when schools actually use classroom-level data, rather than merely collect it?
They move faster, target support more effectively, and create change that persists.
On the flip side, schools without strong data systems often get stuck guessing. For many in the CSI status, that guesswork is precisely what prevents them from improving.
When the Data Works for You
In schools that use data well, decisions are clearer, and support is more focused.
Research from Massachusetts found that a one-point increase in observed instructional quality was associated with a 5.1-percentage-point increase in math growth and a 4.4-percentage-point increase in ELA. Those are substantial gains for students in struggling schools, and they weren’t tied to test preparation. They came from better day-to-day teaching.
How did those schools do it? Frequent observation. The research recommends 6 to 10 observations per teacher each year, across different lessons and by multiple observers. That’s what gives school leaders a real picture of what’s happening.
Additionally, schools making progress often conduct monthly or biweekly formative assessments to identify learning gaps early. These short cycles facilitate adjustments to instruction before minor problems escalate.
What Happens Without It
A 2021 RAND study found that 58% of educators reported data access barriers due to the use of multiple platforms, delaying insights by 3-5 hours per week on average.
This aligns with patterns in which 65% of teachers in a 2022 EdWeek survey cited fragmented data tools as blocking timely interventions.
That leads to common RCA mistakes. Without sufficient classroom data, schools often resort to vague explanations such as “lack of rigor” or “low student engagement.” They invest in PD that appears helpful but doesn’t align with the real need. They struggle to assess whether anything is improving.
In fact, many schools stay in CSI status beyond the 3-year exit window, even after submitting improvement plans. One reason: they can’t track whether their interventions are working at the classroom level.
The ASDB Story: What Changed When They Had the Right Tools
Meghan Boyle, principal at the Arizona School for the Deaf and the Blind, previously faced this exact problem. Walkthroughs were done on paper. Feedback took days to deliver. She managed one visit per classroom per semester, if that.
Then her team adopted Education Walkthrough.
She now conducts quarterly walkthroughs and weekly check-ins across 40 classrooms. Teachers get quick, clear feedback in PDF form. Patterns are easier to see, and decisions feel grounded.
Some changes were simple but powerful:
- Improved visibility: Administrators can track walkthrough counts and identify where support is needed.
- Stronger PD: Data showed a need to improve the classroom environment. That led to new training strategies across the school.
- Reduced workload for staff: Teachers preferred the digital forms. One said it “took the scary out of getting feedback.”
- ASL accessibility: The team uses the built-in video feature to add messages in American Sign Language, which was a huge plus for their staff.
ASDB didn’t just gain a tool. They gained momentum. Classroom data is more than a compliance check. When used well, it uncovers the real drivers of student growth — and where schools are stuck.
In a Massachusetts study, 43 percent of low-performing schools had high variation in emotional support across classrooms. But you’d never know that from schoolwide averages alone. Without classroom-level data, those gaps stay hidden.
The schools that succeed use platforms such as Education Walkthrough to identify what matters. They can:
- Find which classrooms need help
- Target support in real time
- Track if instruction is improving
- Build trust with teachers through regular feedback
In short, they stop guessing.
Common Roadblocks: Why Good Plans Still Fall Short
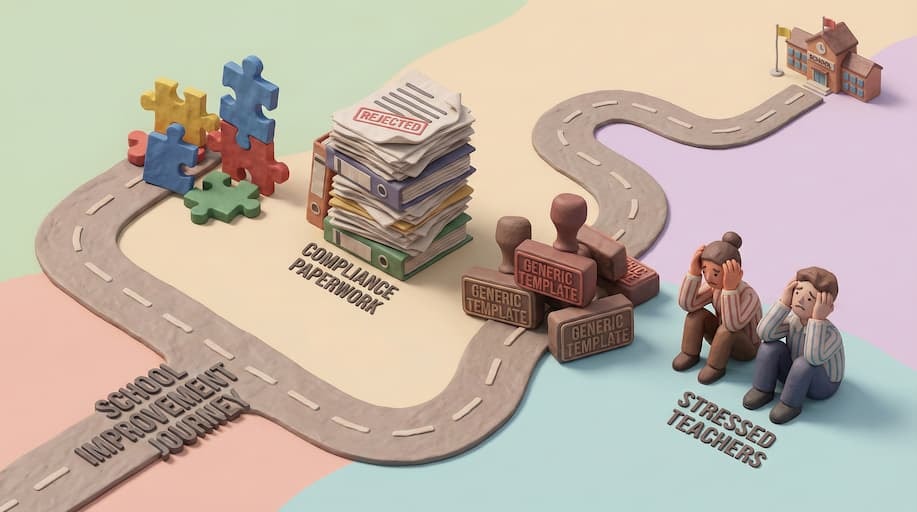
Even when school districts adopt classroom-level data strategies to meet the requirements of the Every Student Succeeds Act, success is not automatic. The tools matter, but consistent use is what drives results.
Here’s why the lowest-performing schools often struggle, even with resources in hand.
1. Data That’s Scattered or Incomplete
Without a unified school accountability system, information is often stored across different platforms, making it difficult to identify patterns or target support.
This slows down the delivery of real-time support and creates confusion among school leaders and teachers, especially in large public school systems.
“It felt like I was managing eight different systems just to understand what was going on in five classrooms.”
— District Leader, Arizona
2. RCA Treated as One-Time Compliance
The Student Success Act requires schools to conduct a root-cause analysis when identified as needing comprehensive support. But too often, this becomes a one-time paperwork exercise. Real school improvement depends on ongoing analysis and feedback.
A 2023 Maryland study found that schools identified for support rarely updated their findings. RCA conclusions were reused year after year, even when classroom realities had changed. Without fresh data, school improvement plans go stale.
3. Generic Templates and Surface-Level Causes
Many school improvement plans rely on pre-filled RCA templates. These forms often cite vague root causes such as “low expectations” or “lack of engagement” without presenting data from elementary and middle schools, where instruction occurs.
Such plans miss the chance to address student learning needs, especially for student groups like those with significant cognitive disabilities or students learning through alternate academic achievement standards.
4. Teacher Resistance and Burnout
Data collection can feel punitive if not paired with meaningful support. Without clear communication and follow-up, walkthroughs may feel like micromanagement. This leads to resistance and low morale.
Research from Maryland CSI schools found that school community burnout increased when walkthroughs and fidelity checks were disconnected from actual student growth or from support for teachers.
This is especially true in schools serving low-income families, where staff are already stretched thin. A strong data system must be paired with coaching and trust to drive sustainable school improvement.
Why Classroom Data Is the Exit Strategy
Escaping comprehensive support and improvement status in schools requires more than a plan. It requires a shift in how schools see and respond to instruction. While the Student Success Act provides federal expectations, real progress depends on the quality of local data.
How Schools Exit CSI Faster
Studies from Massachusetts and Ed Direction show that schools using frequent formative assessments and regular walkthroughs are more likely to meet exit criteria within the three-year window. In contrast, schools relying solely on annual academic assessments often remain stuck.
Aggregated Data Hides Real Problems
Many school accountability systems rely on averages. But in a Massachusetts study, 43% of low-performing schools showed high variation in emotional support across classrooms. Without classroom-level data, these gaps remained invisible.
Disaggregated data helps identify where specific student subgroups are being underserved. This includes students receiving services under the Individuals with Disabilities Education Act, students enrolled in alternate diploma pathways, and those working toward challenging academic standards.
Data is Not Just for Compliance
Too often, school improvement funds are spent on programs with limited tracking. But when schools use data to guide weekly decisions, they can:
- Align supports to the right grade level
- Focus coaching on actual gaps in academic growth
- Measure whether strategies are reaching student groups equitably
This level of clarity helps school leaders direct resources more effectively and demonstrate student outcomes aligned with the state’s accountability system.
Conclusion: A District Blueprint for Exiting CSI Status
To meet the CSI exit criteria, districts must move beyond annual summaries and invest in real-time insight into instruction. Student subgroups, including English language learners and those on alternate assessments, need targeted support now, not after another school year.
Tools like Education Walkthrough help track what is actually happening at the grade level, offering clarity and consistency. That is how significant progress becomes possible. The statewide accountability system identifies the lowest performing schools, but how they improve is up to you.
FAQs
Still have questions about escapting CSI status? We’re happy to help!
Can’t we rely on state test scores and graduation rates alone to guide our CSI improvement plans?
No. While these academic indicators are part of statewide accountability systems, they come too late to guide real-time improvements. To truly address issues in public education, schools need classroom-level observation and formative assessment data that highlight what’s happening during instruction, especially for specific student subgroups.
How many classroom observations and formative assessments are realistic for a district with limited staff capacity?
For schools identified for comprehensive support, a realistic goal is 6–8 short observations per teacher per school year, and 3–4 formative assessments per grade level. If capacity is limited, start smaller, 4–6 observations, and focus first on CSI campuses before scaling up to additional targeted support schools.
How do we prevent classroom data from being used punitively and damaging teacher morale?
You prevent misuse by clearly communicating that the data is for growth, not evaluation. When teachers co-create observation rubrics and see how data leads to evidence-based practices and real support for English language learners or students taking alternate assessments, trust builds naturally.
What if our current systems (SIS, LMS, assessment platforms) don’t integrate easily, do we need a new data warehouse before we start?
No, you don’t need a complex platform in year one. Many districts use spreadsheets or simple dashboards, tagging data by grade level, student group, and teacher, then expand later as they adopt promising practices supported by technical assistance or competitive grants.
How should we report classroom-level findings to state agencies without overwhelming them or exposing individual teachers?
Aggregate findings by grade level and subject for external reporting. States are interested in methodology and progress across student subgroups, not in individual teacher scores. This respects state law while showing that your district is using strong RCA aligned with such measures as those used by more effective schools.