One-Click Instructional Leadership is a digital documentation strategy that automates the collection of classroom walkthroughs, coaching cycles, and PLC data into auditor-ready reports.
By centralizing evidence in real-time, school leaders can demonstrate compliance with ESSA and CSI/TSI frameworks without manual compilation
Here’s the good news.
Learning how to prove instructional leadership with one click is not only possible, it’s a game-changer.
With the right tools, instructional leaders can turn walkthroughs, coaching notes, and collaborative planning into audit-ready reports in seconds.
No spreadsheets. No scrambling. Just real, organized documentation that captures the heart of your educational leadership.
This guide examines the automation of school leadership evidence:
- Why is digital documentation critical for ESSA compliance?
- What artifacts qualify as valid evidence?
- How do you implement a reporting system using tools like Education Walkthrough?
Key Takeaways
- Principals in 2025 can generate auditor-ready instructional leadership reports from existing walkthrough and coaching data with a single click, using tools like RigorWalk™, Education Walkthrough, or district dashboards.
- “One click” does not mean faking evidence—it means systematically collecting real walkthrough, coaching, and PLC data all year, then exporting it instantly as a PDF or dashboard view during state or district reviews.
- Auditors and supervisors look for specific proof points: regular classroom walkthroughs, goal-setting with teachers, evidence of feedback and follow-up, and clear impact on student learning trends.
- Principals in low-performing schools can reduce stress and appear highly organized by standardizing templates, logging every visit, and using color-coded trend dashboards to tell a clear improvement story.
- This article walks you step-by-step from raw classroom visits to a polished, one-click report you can show a state team tomorrow.
Why “One Click” Proof of Instructional Leadership Matters Now
State accountability reviews for CSI (Comprehensive Support and Improvement) schools now require immediate access to longitudinal leadership data.
Regulatory bodies no longer accept anecdotal leadership philosophies; they demand documented evidence of consistent classroom presence, specific feedback cycles, and data-driven decision-making.
Leaders who cannot produce time-stamped logs and trend analysis within the standard 10-day notice window risk punitive interventions, including district oversight or leadership replacement.
They want documented evidence of instructional leadership. Can you provide it quickly and confidently?
Principals must provide documented evidence of instructional coaching, student work analysis, and data-driven interventions to satisfy state review teams.
The Shift from Informal Updates to ESSA-Mandated Evidence
Under the 2015 ESSA framework, states are mandated to identify CSI and TSI schools on a three-year cycle, with the next major identification wave occurring in 2026.
Schools flagged for Comprehensive Support and Improvement (CSI) or Targeted Support and Improvement (TSI) face serious interventions. These may include oversight from the district, leadership changes, or even closure.
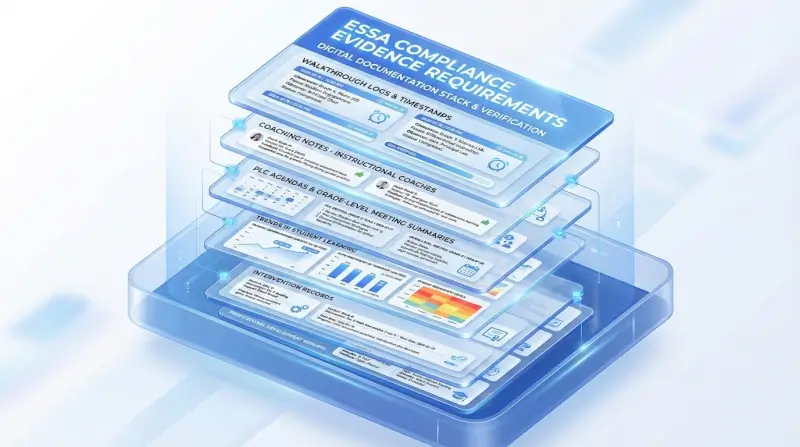
District leaders and external reviewers no longer accept informal updates. They expect digital documentation that proves consistent instructional improvement. That includes:
- Walkthrough logs with timestamps
- Coaching notes from instructional coaches
- PLC agendas and grade-level meeting summaries
- Trends in student learning
- Intervention records
- Reports that link professional development to changes in teacher practice and student outcomes
This reflects a national shift toward evidence-based leadership. Accountability systems are moving toward support, but they still require proof that school leaders are acting on data and improving results.
Evidence-based interventions require documented evidence. States are shifting from punitive accountability to support and improvement, but they still require proof that leadership is acting on data.
— Wallace Foundation Evidence Review, 2023
Instructional Leadership Is About Leading Learning
Modern Instructional Leadership is defined by the systematic monitoring of pedagogical progress rather than logistical management.
Effective leaders utilize three core mechanisms: frequent micro-observations (walkthroughs), actionable coaching feedback, and collaborative data review (PLCs).
This shift from ‘manager’ to ‘lead learner’ requires a digital infrastructure that tracks these interactions as quantifiable data points for school improvement.
To be credible, this work must be documented consistently. Strong leadership systems include:
- Regular classroom observations
- Coaching conversations with follow-up
- Clear student learning goals
- Evidence of focused professional development
- Growth in teacher practice across grade levels
- School improvement efforts aligned to real needs
These records show that your leadership practice is strategic and focused on student success.
Your Data Can Tell the Full Story
You do not need to take on more work. You need to capture the work you already do.
According to a 2023 Wallace Foundation Evidence Review, leaders who consistently log coaching cycles demonstrate a statistically significant impact on student achievement.
In districts like Freeport School District 145, the digitization of these logs allowed leaders to correlate feedback frequency with a rise in Tier 1 instruction.
They can show how instructional coaches provided targeted support, how professional learning addressed specific gaps, and how teacher effectiveness improved.
For example:
- In September, classroom observations showed limited student talk.
- You launched a professional development cycle focused on academic discourse.
- Coaches modeled strategies and followed up with teachers.
- By December, walkthroughs showed stronger student engagement, and benchmarks reflected gains in student achievement.
This is the kind of clear, connected evidence that builds trust and credibility.
Organized Evidence Builds Confidence
You should not be piecing together last-minute documents before a review. With the right systems in place, you can generate a professional report in seconds.
Automated reports demonstrate leadership impact by visualizing:
- Classroom Frequency: The volume and distribution of principal visits across grade levels.
- Pedagogical Growth: The longitudinal improvement of teacher practice in specific domains.
- Strategic Alignment: The correlation between professional development topics and observed classroom behaviors.
This is not about presenting perfect results. It is about showing thoughtful leadership, honest reflection, and continuous instructional improvement. When you can do that, you are not only prepared for accountability but also for success. You are strengthening your school community and improving student outcomes.
What Artifacts Qualify as Instructional Leadership Evidence?
Instructional leadership is about more than managing tasks or putting out fires. It’s about helping teachers improve instruction and supporting students in meaningful ways. That kind of work deserves to be seen and documented.
Good principals don’t just hope things improve. They set goals, check in often, and use real classroom evidence to guide decisions. When it’s time to show your leadership, you don’t need fancy language. You need clear, simple proof that you’re focused on instruction and student learning.
Three Things Great Leaders Do Consistently
Across high-performing schools, effective instructional leaders tend to focus on three key areas:
1. Set Goals That Matter
They work with teachers to set clear, measurable goals tied to what students need most, whether it’s a specific skill, a shift in group work, or a new instructional strategy.
2. Give Regular Feedback From Real Classroom Visits
They pop into classrooms often, not just for formal observations, but to support, listen, and offer feedback that teachers can use right away. These quick visits help track what’s working and what needs attention.
3. Help Teams Use Data to Improve Practice
They support grade-level teams and PLCs in using student work and data to plan instruction, adjust lessons, and solve problems together. These conversations often lead to better, more focused teaching.
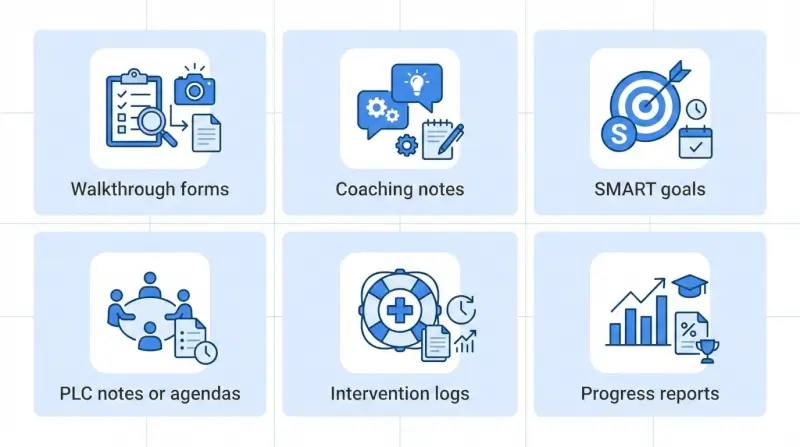
What Counts as Evidence?
If someone asks, “How do you know your leadership is helping improve student learning?” here’s what you can show:
These artifacts don’t need to be complicated. They just need to be consistent, honest, and connected to your instructional work.
Improvement Evidence vs. Evaluation Evidence
There’s a big difference between rating teachers and supporting them. Walkthrough and coaching data should show patterns, not judgments. It’s about documenting growth, trends, and support over time.
Here’s an example of strong improvement evidence:
“Between mid-August and late October, 30 math classroom visits were logged. In that time, student discussion improved from 42 percent to 71 percent of observed lessons.”
That kind of detail is specific, easy to understand, and clearly linked to the impact of your leadership.
Put It All in One Place
When walkthrough notes are in your notebook, coaching feedback is in an email, and PLC plans live in a shared drive, it’s hard to get the full picture.
Instead, try bringing it all together. When you organize your documentation in one place, you make it easier to track growth, reflect on your leadership practice, and show others what’s working. You can check in with teachers, share progress, and adjust as needed, without having to dig through scattered notes.
Instructional leadership doesn’t need to be perfect. But it should be visible.
When your practice is documented clearly, you’re not just more prepared for accountability. You’re helping your teachers grow, improving instruction, and creating better outcomes for your students — and that’s the kind of leadership that sticks.
How Do You Implement a One-Click Leadership Reporting System?
Implementing a one-click reporting system requires the standardization of data inputs across three core domains: classroom walkthroughs, coaching logs, and PLC meeting notes.
Without standardized templates, data remains unstructured and impossible to aggregate into a cohesive trend report. When walkthroughs live in one place, coaching notes in another, and PLC documentation is scattered across shared drives, pulling evidence becomes stressful and time-consuming.
Strong instructional leaders simplify this by building a few consistent routines. The goal is not more documentation. The goal is clearer documentation that reflects the work already happening in classrooms.
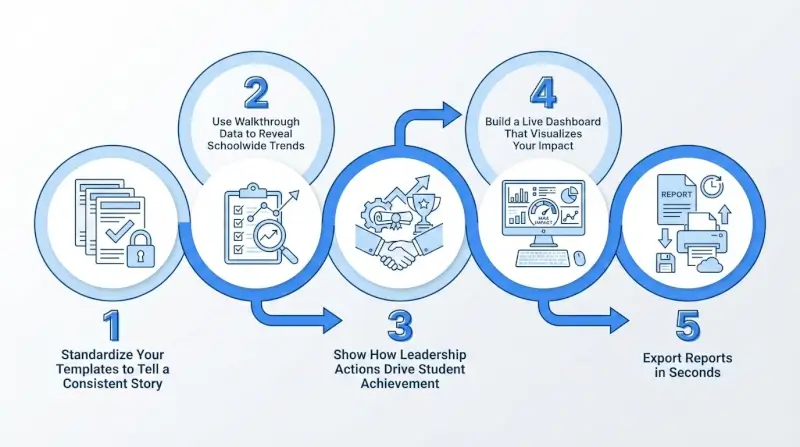
Step 1: Standardize Your Templates to Tell a Consistent Story
Consistency is what makes your leadership visible. When every visit, conversation, and meeting follows the same structure, patterns emerge naturally, and reports become easy to generate.
By the start of each school year, school leaders should standardize three core templates.
1. Classroom Walkthrough Template
Your walkthrough form should focus on a small number of research-aligned look-fors connected to school improvement goals. Tools like Education Walkthrough make this easy by allowing leaders to customize fields while keeping data consistent.
Include items such as:
- Date, time, grade level, and subject
- Student engagement based on observation
- Questioning level used by the teacher
- Student discourse and explanation
- Evidence of checks for understanding
- Use of academic language
- Alignment to the learning objective
2. Coaching and Feedback Notes
Coaching documentation should clearly show how leaders support teachers over time.
- Teacher name and date
- The specific classroom observation referenced
- Feedback shared using objective language
- A clear next step
- A scheduled follow-up
Education Walkthrough allows leaders and instructional coaches to keep this information connected to walkthroughs, reducing duplication and confusion.
3. PLC and Data Meeting Notes
These notes show how instructional decisions are made collaboratively.
- Meeting date and participants
- Data reviewed, including assessments or student work
- Key takeaways
- Action steps with owners and timelines
- Connection to school improvement goals
Step 2: Use Walkthrough Data to Reveal Schoolwide Trends
Single observations rarely tell a full story. Trends do.
A few scattered notes from classroom visits do not help reviewers understand leadership impact. Hundreds of short, consistent walkthroughs do. The difference between leaders who feel unprepared and those who feel confident often comes down to whether they turned walkthroughs into trend data.
Platforms like Education Walkthrough help leaders move from isolated notes to clear patterns.
A simple process works well:
- Use the same fields for every walkthrough
- Log observations immediately while details are fresh
- Let the system calculate trends over time
For example, Education Walkthrough can show that 68 percent of September walkthroughs in grades three through five included strong student discussion, compared to 42 percent in August. That kind of insight is hard to miss and easy to explain.
Short, frequent walkthroughs also change the scale of your evidence. Instead of one or two formal observations per teacher each year, effective instructional leadership shows up as a steady classroom presence across the school.
Step 3: Show How Leadership Actions Drive Student Achievement
Documentation matters most when it connects leadership actions to student outcomes.
Reviewers want to see that instructional leadership leads to better learning, not just better records. Walkthrough data becomes powerful when it connects to professional development, coaching, and student performance.
Here is how that connection typically looks:
- Early walkthroughs reveal a pattern, such as limited student explanation in math
- School leaders respond with focused professional development
- Instructional coaches model strategies and provide ongoing support
- Follow-up walkthroughs show changes in classroom instruction
- Assessment data reflect improvement in student achievement
Education Walkthrough supports this process by keeping walkthroughs, feedback, and reports linked, making it easier to monitor progress and adjust when needed.
Your reports should combine:
- Trend charts that show instructional change over time
- Short summaries explaining what leaders noticed and how they responded
- Samples of student work, de-identified, that show growth
This is not about showing perfection. It is about showing that you notice patterns, apply feedback, and make adjustments when challenges arise.
Step 4: Build a Live Dashboard That Visualizes Your Impact
Let’s face it. No one has time to dig through folders and piece together a story from scattered notes. That’s where a real-time instructional dashboard comes in. It gives school leaders and instructional coaches a clear, at-a-glance view of what’s happening across classrooms, grade levels, and teams, all in one place.
With platforms like Education Walkthrough, you can easily track:
- How often walkthroughs are happening
- What’s showing up in classrooms (like student talk or higher-order questions)
- Coaching activity and follow-up
- Instructional trends by subject or grade
- How teacher feedback connects to student learning
And the best part? You don’t need to crunch numbers. The system does it for you.
A Real Example: FSD145 Got It Right
In Freeport School District 145, things used to be pretty scattered. Walkthroughs varied from building to building, feedback was inconsistent, and it was hard to get a full view of what was actually happening in classrooms.
Once they started using Education Walkthrough, everything changed. Walkthroughs became part of the leadership routine, data was automatically organized, and district leaders could finally make decisions based on clear patterns instead of guesswork.
Georgia Mathis, a district leader at FSD145, put it simply:
“The system is now much more structured, consistent, and focused on ongoing improvement. It’s helped us improve Tier 1 instruction and student achievement.”
They also used the dashboard to tailor professional development, set goals with teachers, and create real alignment across schools.
A strong dashboard doesn’t just check a box. It helps leaders spot what’s working, follow up when needed, and support teachers in ways that actually move student learning forward.
Read the Full Freeport School District 145 Case Study
Step 5: Export Reports in Seconds (No More Last-Minute Scrambling)
A true one-click report means selecting a date range and clicking export. Tools like Education Walkthrough make this process simple by automatically formatting data into clean, professional PDFs.
A strong one-click report typically includes:
- A summary page with totals and coverage
- Trend charts showing instructional growth
- Grade-level comparisons
- Identified strengths and growth areas
- A short leadership reflection explaining next steps
The same report can support multiple needs:
- State accountability reviews
- District principal evaluations
- Board updates
- School improvement planning
Strong reports clearly separate compliance from improvement. They show both the frequency of leadership actions and how those actions led to changes in classroom instruction and student outcomes.
In districts like Youngstown City Schools, leaders have been asked to demonstrate how they monitored instruction. A well-organized walkthrough report can answer that question in minutes instead of hours.
Ethical Guardrails: Real Evidence, Not Manufactured Metrics
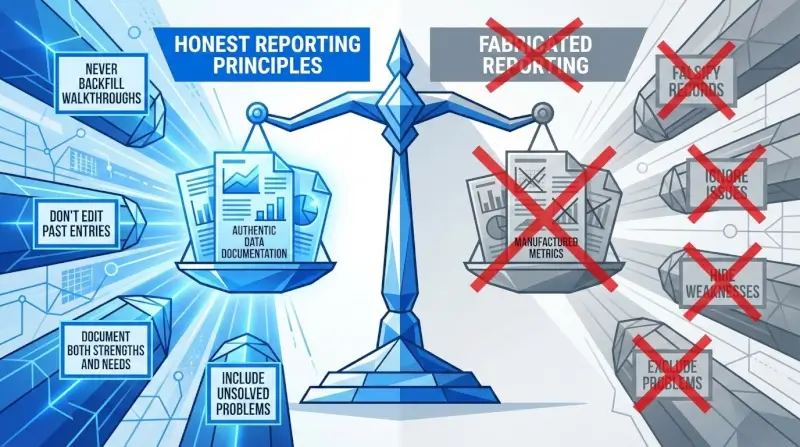
The purpose of dashboards and one-click reports is to surface and organize real instructional work, not to fabricate or inflate evidence. This distinction matters, both ethically and practically.
State accountability frameworks and data quality guidance consistently emphasize that evidence must be genuine. Reports should reflect authentic classroom observations, actual teacher improvement efforts, and real student achievement patterns.
Four Ethical Practices for Instructional Leadership Evidence
If you’re using tools like Education Walkthrough to track classroom observations and feedback, the goal is simple: show real instructional work, clearly and confidently. That only works if the data reflects what’s actually happening.
Here’s how to keep your reporting clean, credible, and trustworthy:
- Never backfill walkthroughs: Don’t create observation records for visits that didn’t happen. Systems log timestamps and user IDs; manipulation is both unethical and detectable.
- Don’t edit past entries: If September data looked weak, leave it. Show the improvement trajectory instead of erasing the starting point.
- Document both strengths and needs: Auditors trust reports that acknowledge challenges. A dashboard showing only perfect scores raises suspicion.
- Include unsolved problems: If walkthrough data reveals an area where you haven’t yet made progress, include it with a clear explanation of your plan. This demonstrates honest self-assessment.
Protecting Privacy in Reports
When including specific examples:
- De-identify teacher and student names in samples
- Use aggregate data whenever possible
- Follow FERPA requirements and local policies
- Share only what’s necessary to tell the improvement story
Honest, well-organized partial progress with clear next steps often earns more trust from reviewers than perfect-looking but unrealistic data. Great leaders don’t hide problems—they show how they’re addressing them.
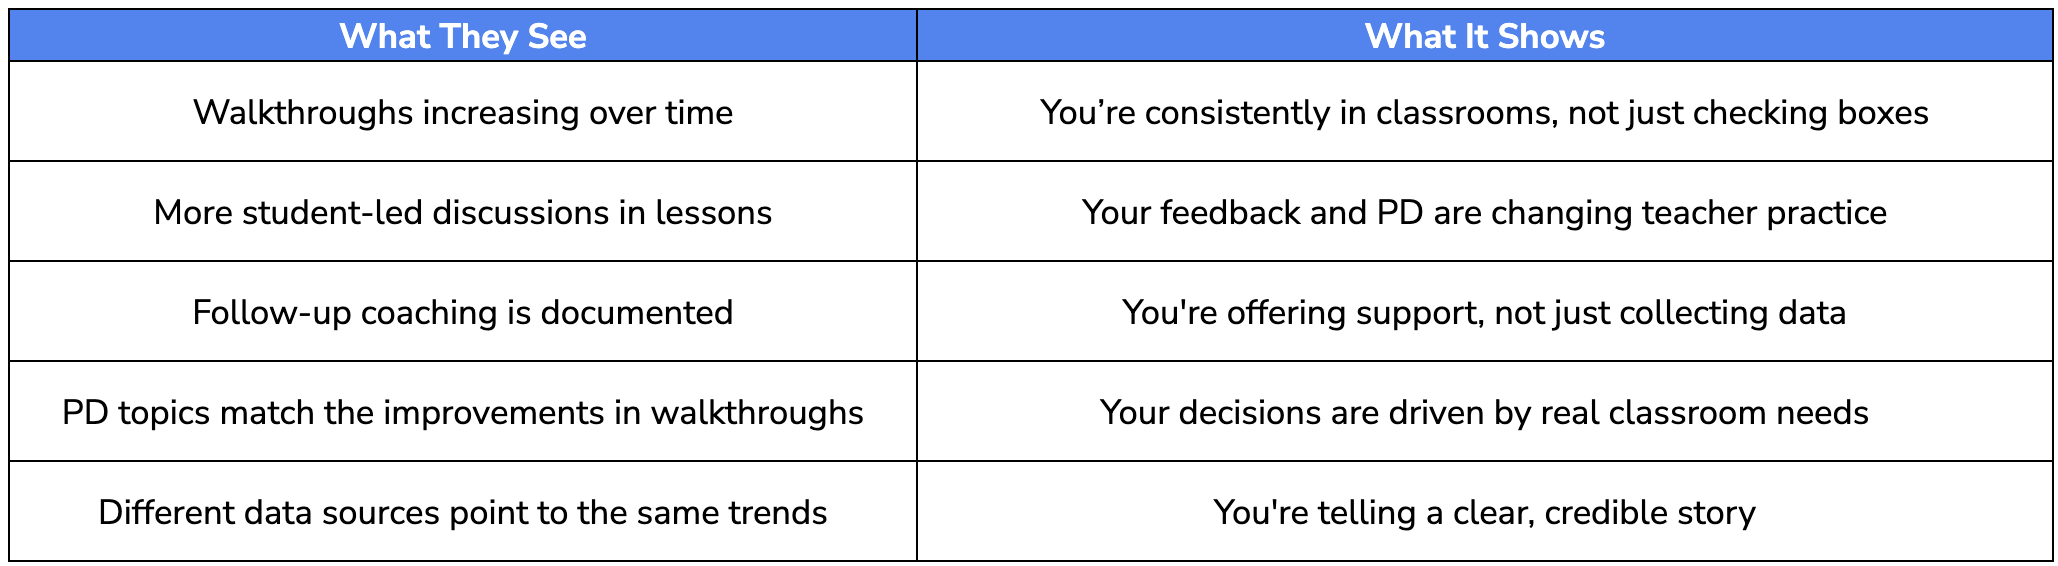
What Strong Instructional Leadership Looks Like in the Data
When district leaders or reviewers scan your dashboard, they’re not just checking for compliance. They’re looking for meaningful patterns that show your leadership is intentional, consistent, and improving outcomes for both teachers and students.
What Reviewers Are Really Looking For
Here are the specific data signals that suggest your leadership is making a difference:
How These Patterns Show Up in Real Schools
Here are two quick examples that show what instructional leadership can look like in action:
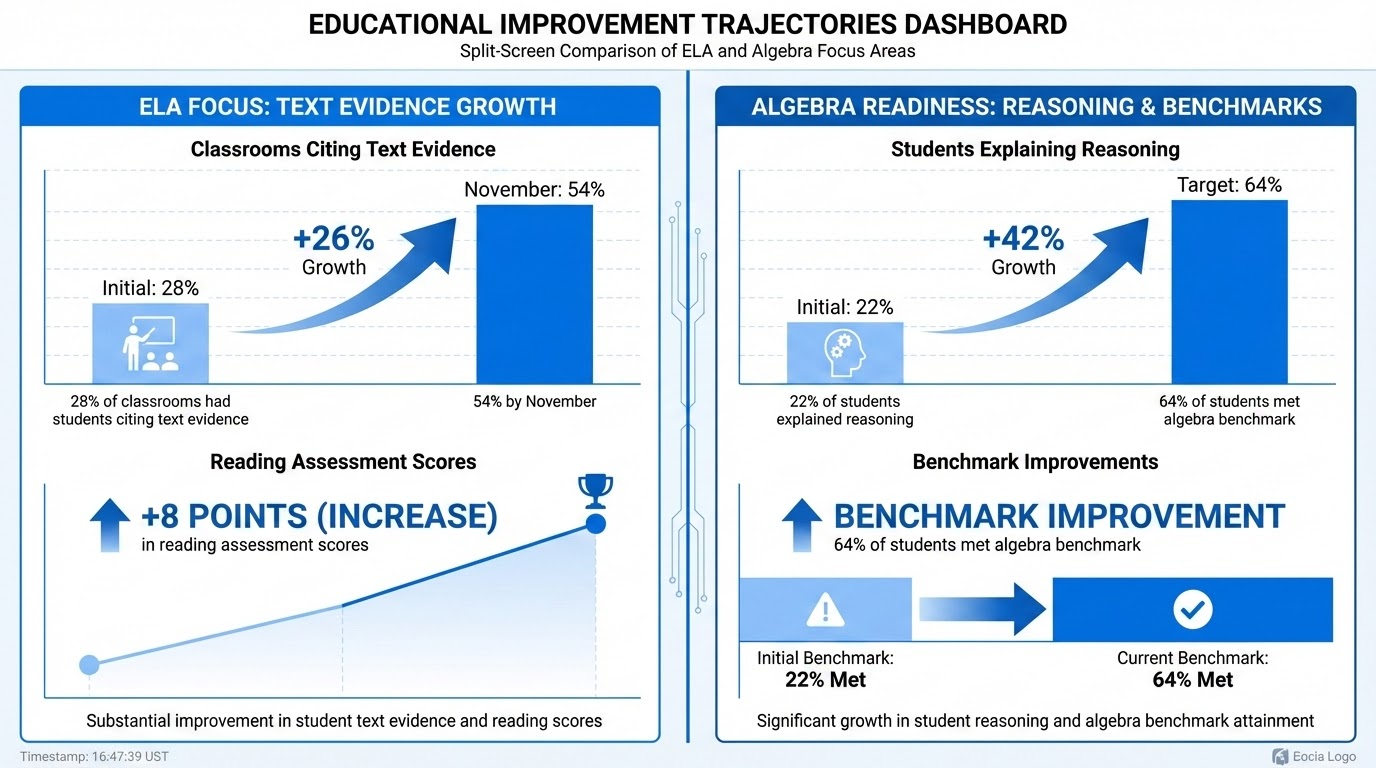
ELA Focus (Grades 3–5)
- In September, walkthroughs showed that only 28% of classrooms had students citing text evidence.
- After collaborative planning and modeling by instructional coaches in October, that number jumped to 54% by November.
- By December, reading assessment scores rose 8 points in text-based analysis.
Algebra Readiness (Grade 8)
- August–September walkthroughs showed that only 22% of students explained their reasoning.
- The leadership team responded with targeted peer explanation strategies.
- By January, 64% of students met the algebra benchmark, up from 51% just a few months earlier.
When your data tells a clear story, backed by walkthroughs, feedback, and visible progress — it builds trust with teachers, gives your district leaders confidence, and shows your commitment to instructional growth.
Countdown to Review: Your 10-Day Prep Plan for a Successful Visit
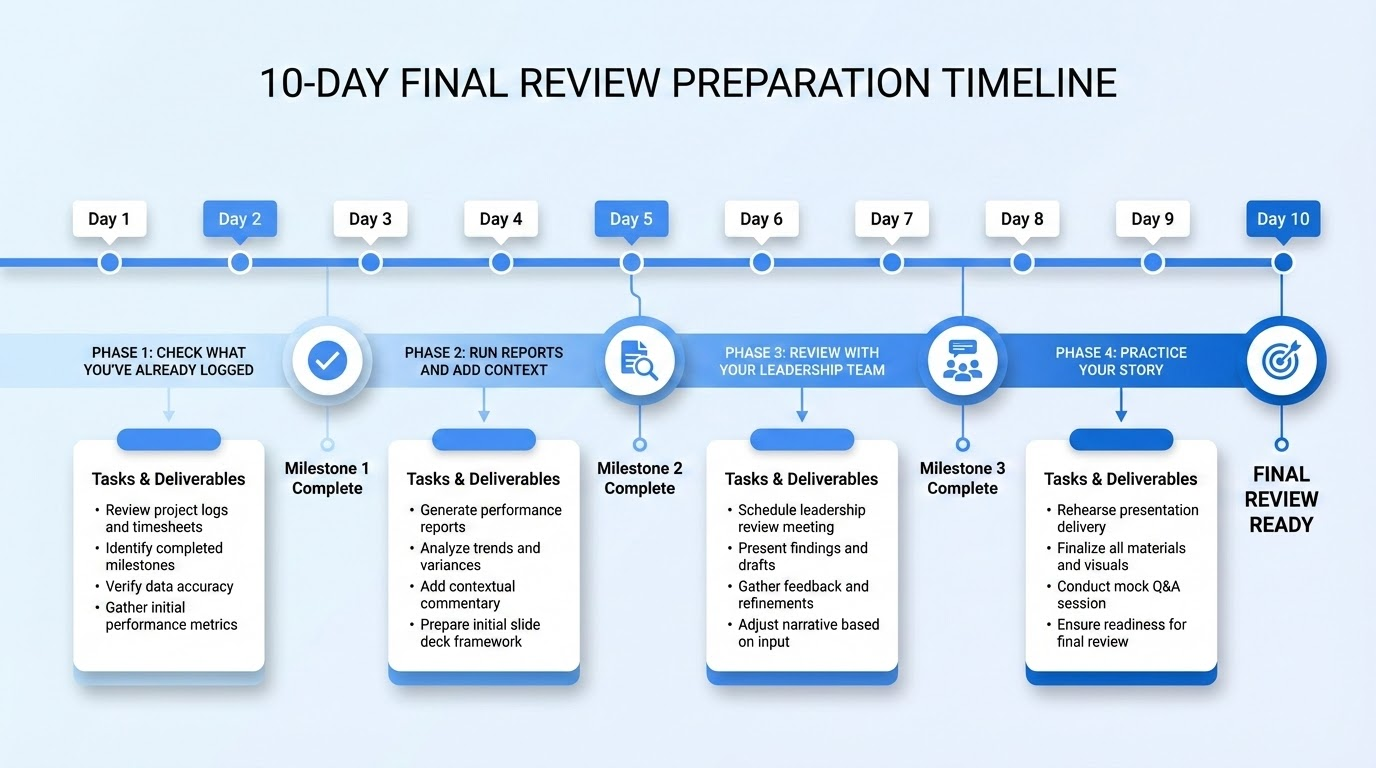
With 10 days to prepare, it’s completely possible to organize your walkthrough data, show leadership impact, and walk into the meeting with confidence.
Here’s your step-by-step plan.
Days 1 to 2: Check What You’ve Already Logged
Start by reviewing the essentials. This gives you a clear picture of what’s done and what’s missing.
- Review all classroom walkthroughs completed since the start of the year
- Look for any coverage gaps, such as unvisited teachers or missing grade levels
- Confirm that coaching notes, PLC documentation, and team meeting records are stored properly and are easy to access
Days 3 to 5: Run Reports and Add Context
Once the data is complete, focus on generating clear, clean reports that show your leadership in action.
- Use your one-click report tool, like Education Walkthrough, to generate a semester overview
- Include a short reflection that highlights what changed and why
- Review charts and graphs for clarity, consistency, and accuracy
- Select visuals that make progress easy to understand for outside reviewers
Days 6 to 8: Review With Your Leadership Team
Now that your draft is ready, invite a few key team members to help review it. A second opinion helps catch small errors and strengthens your final version.
- Share your report with assistant principals, instructional coaches, or your data lead
- Double-check walkthrough counts, coverage rates, and any data that may need updating
- Make sure student growth data is current and reflects recent assessment results
Days 9 to 10: Practice Your Story
Your data is solid. Now it’s time to prepare how you’ll present it. Keep it simple, direct, and grounded in your leadership work.
- Choose two or three clear stories that connect your leadership actions to outcomes
- Practice walking through your report using charts or data visuals as a guide
- Prepare for common questions like:
- What did you do after identifying this trend?
- How did teachers respond to feedback?
- How does this tie to your school improvement plan?
Organize Your Evidence by Theme
Whether you’re sharing a digital folder or printed binder, group your materials by category. This helps you stay organized and gives reviewers an easy way to follow your line of thought.
Set up folders for:
- Walkthroughs: Full report, sample forms, notes
- Coaching Cycles: Feedback examples, follow-up logs
- PLCs: Agendas, action items, team notes
- Assessment Data: Benchmarks, growth charts, subgroup trends
- School Improvement Alignment: Quick summary linking your evidence to SIP goals
Every piece of documentation should connect to a section in your one-click report. When someone asks for proof, you’ll be ready with everything in one place.
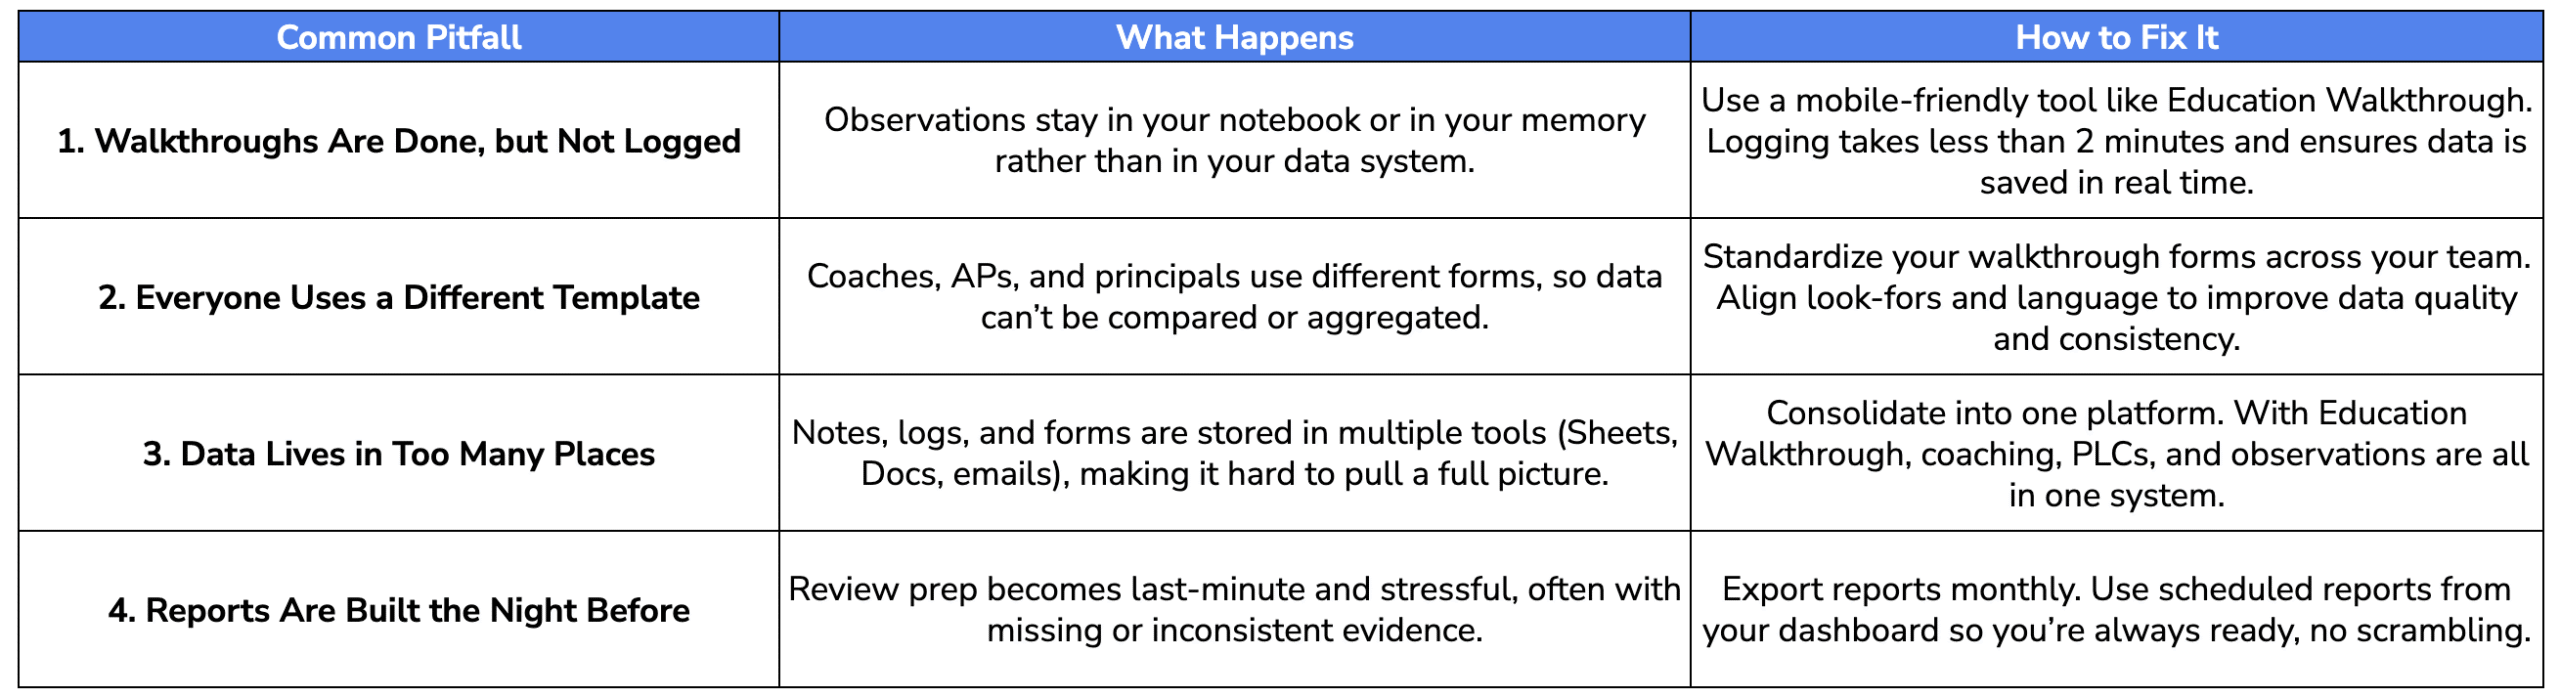
Common Pitfalls (and How Dashboards Help You Avoid Them)
Even experienced school leaders can fall into small traps that quietly stall progress. These missteps don’t stem from a lack of effort; they often occur when leaders are juggling too much without the right systems in place.
Use this quick-reference table to identify common pitfalls in walkthrough and coaching systems, and how Education Walkthrough or similar tools can help address them before they cause stress.
Addressing Common Objections
Sometimes the hesitation isn’t technical. It’s about perception or time. Here’s how to respond to the most common pushback from your team:
“This will take more time.”
Actually, short, frequent walkthroughs with fast digital logging often save time compared to long formal observations and written summaries.
“Teachers will feel micromanaged.”
When walkthroughs are framed as low-stakes and used for trends and instructional decisions — not evaluation, trust usually increases. Many teachers appreciate timely, actionable feedback they can apply.
“Our district has too many tools already.”
Pick one platform to house your instructional leadership evidence. If you can’t streamline the tech, at least keep all walkthroughs, feedback, and student data in one place.
Implementation Roadmap: From First Walkthrough to First One-Click Report
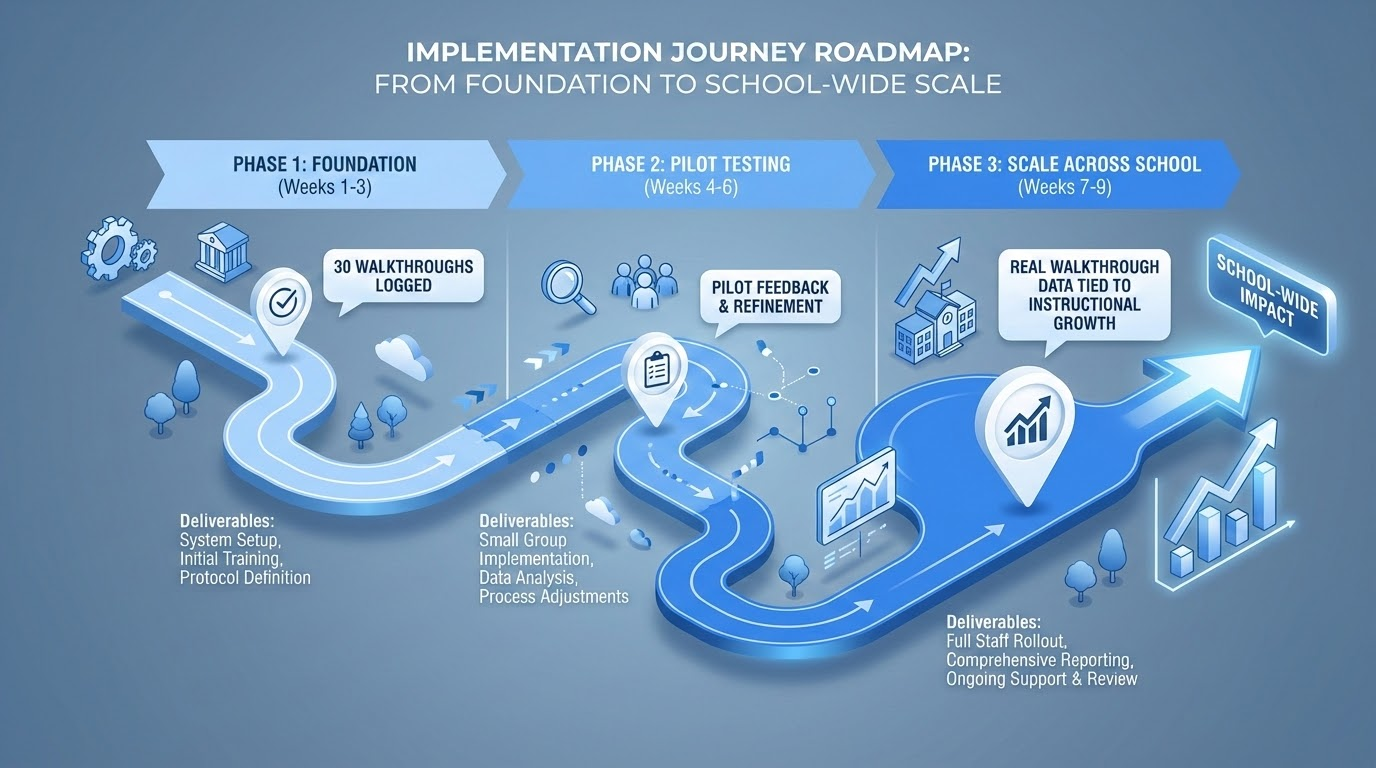
You don’t have to overhaul your systems overnight. Start small and scale smart. Here’s a practical roadmap to turn scattered notes into a fully functional, one-click dashboard.
Phase 1: Foundation (Weeks 1 to 3)
Start by setting the groundwork for success. Focus on building shared tools, aligning expectations, and training your team.
Tasks:
- Select a walkthrough tool like Education Walkthrough or a shared Google Form
- Customize templates with 5 to 8 look-fors aligned to your school improvement plan
- Calibrate with your assistant principals and instructional coaches
- Communicate the purpose clearly to teachers: this is about instructional improvement, not surveillance
Milestone: Everyone on the team understands the walkthrough process and has the tools to start.
Phase 2: Pilot and Calibrate (Weeks 4 to 6)
Now you can test the system in a controlled setting and adjust before schoolwide use.
Tasks:
- Pilot walkthroughs with one grade level or department
- Review the data, refine your tags, and clarify how you’re tracking patterns
- Build your first draft report or dashboard view
Milestone: At least 30 walkthroughs logged. Initial trends start to emerge. Team feels comfortable using the tool.
Phase 3: Scale Across the School (Weeks 7 to 9)
Once your team is aligned, expand the work across classrooms and begin sharing insights.
Tasks:
- Conduct walkthroughs schoolwide, with all leaders participating
- Check inter-rater reliability to ensure consistency across observers
- Generate your first trend report by grade level
- Share patterns at a staff meeting and discuss how they connect to feedback and PD
Milestone: Your school has real walkthrough data tied to instructional growth, and full access to it through your platform.
How District Leaders Can Support the Rollout
District support makes implementation smoother and more successful. Leaders can help by providing:
- Professional development opportunities on observation tools and instructional data
- Technology support to set up Education Walkthrough or to integrate existing systems
- Clear messaging about the purpose of walkthroughs
- Protected time during early implementation to build momentum
When school and district teams develop systems together, they can monitor progress, solve problems faster, and support teachers more effectively. That’s how instructional improvement takes root with tools that simplify the work and leadership that stays focused on what matters.
Final Thoughts
Proving your impact as an instructional leader doesn’t have to be overwhelming. With the right tools and systems in place, showing how you support teachers, monitor progress, and improve student outcomes can be as simple as clicking a button.
When walkthroughs, feedback, and team planning are captured consistently throughout the year, you don’t just have data. You have a clear story of growth. A story that reflects your leadership practice, builds trust with your team, and supports real instructional improvement.
Tools like Education Walkthrough make it easier to stay organized, stay focused, and stay ready. Not just for audits, but for everyday decisions that move your school forward.
If you’re ready to simplify how you lead, document, and communicate your work, start by standardizing your forms and centralizing your feedback. Then let your dashboard do the rest.
Book a Quick Demo to See How it Works
FAQs
Smart answers for busy school leaders.
How is a one-click instructional leadership report different from a traditional school improvement plan?
A School Improvement Plan (SIP) outlines intent and future strategy, whereas a One-Click Report provides time-stamped evidence of execution. The report validates that the strategies in the SIP—such as frequency of feedback or specific instructional focuses—actually occurred.
What if my school doesn’t have a commercial walkthrough or dashboard platform?
You can still approximate one-click reporting by using standardized Google Forms that feed into Google Sheets. The key is using consistent fields (date, teacher, grade, look-fors) across all observers. Set up simple charts in Sheets and use the “Download as PDF” function to export. It’s not as polished as commercial tools, but it works—and it demonstrates systematic practice to auditors.
How often should I conduct walkthroughs to have enough data for a credible report?
Target at least 1 5-10-minute walkthrough per teacher every 2-3 weeks. In a school with 40 teachers, this means roughly 15-20 walkthroughs per week for the leadership team combined, very achievable when each visit is brief. Over a semester, you’ll accumulate hundreds of data points that clearly show coverage and trends across grades and subjects.
Will frequent walkthroughs and data collection make teachers feel monitored instead of supported?
Research and district case studies consistently show that when leaders are transparent about walkthrough purposes, use low-stakes language, give same-day actionable feedback, and share trend data back with staff, trust and retention typically improve. The key is positioning walkthroughs as learning tools for school leaders, not surveillance mechanisms. Teachers who see their collective data improving often become advocates for the process.
Can these reports help with my own principal evaluation, not just state accountability?
Absolutely. Many districts now require evidence of instructional leadership in principal evaluations. The same dashboards and PDFs you’d show a state team work perfectly for mid-year and end-of-year evaluation meetings with your supervisor. In fact, having organized, data-rich evidence often shifts those conversations from defensive explanations to collaborative problem-solving about fresh perspectives and next steps.