The most effective teacher evaluation frameworks—such as the Danielson Group FFT, Marzano Focused Model, and NIET TAP—combine structured instructional rubrics with frequent, low-stakes classroom observations. When implemented with digital tools for same-day feedback, these frameworks can drive one additional year of student learning.
Effective evaluation systems must combine multiple measures, including frequent classroom observations and timely, actionable feedback. This approach empowers teachers and fosters continuous professional growth rather than just providing a static rating.
This comprehensive guide explores the core evaluation models:
- Why do teacher evaluation frameworks often fail in practice?
- What is the Danielson Framework for Teaching (FFT)?
- How does the Marzano Focused Teacher Evaluation Model work?
- What are the implementation risks of Value-Added Models (VAMs)?
We will address critical questions like: How often should you observe? How can you deliver feedback that teachers actually use? What is the real role of test scores and student surveys?
Key Takeaways
- Over 90% of U.S. states overhauled their teacher evaluation systems after 2009, yet most districts still rate 95–99% of teachers “Effective or better,” which limits genuine differentiation and growth.
- The 10 core frameworks covered here (Danielson, Marzano, Stronge, TAP/NIET, VAM, T-TESS, CSTP, Student Surveys, SLOs, and the Great Teaching Toolkit) each carry different time and cognitive demands for the person actually doing the observing.
- The specific framework you use matters less than how often you observe, how fast you deliver feedback, and whether you have a system that makes your chosen framework usable at scale.
- Education Walkthrough supports Danielson-aligned forms and custom rubrics, reducing paperwork time and helping leaders deliver same-day, actionable feedback to teachers.
Why Teacher Evaluation Frameworks Matter (and Why They Often Fail in Practice)
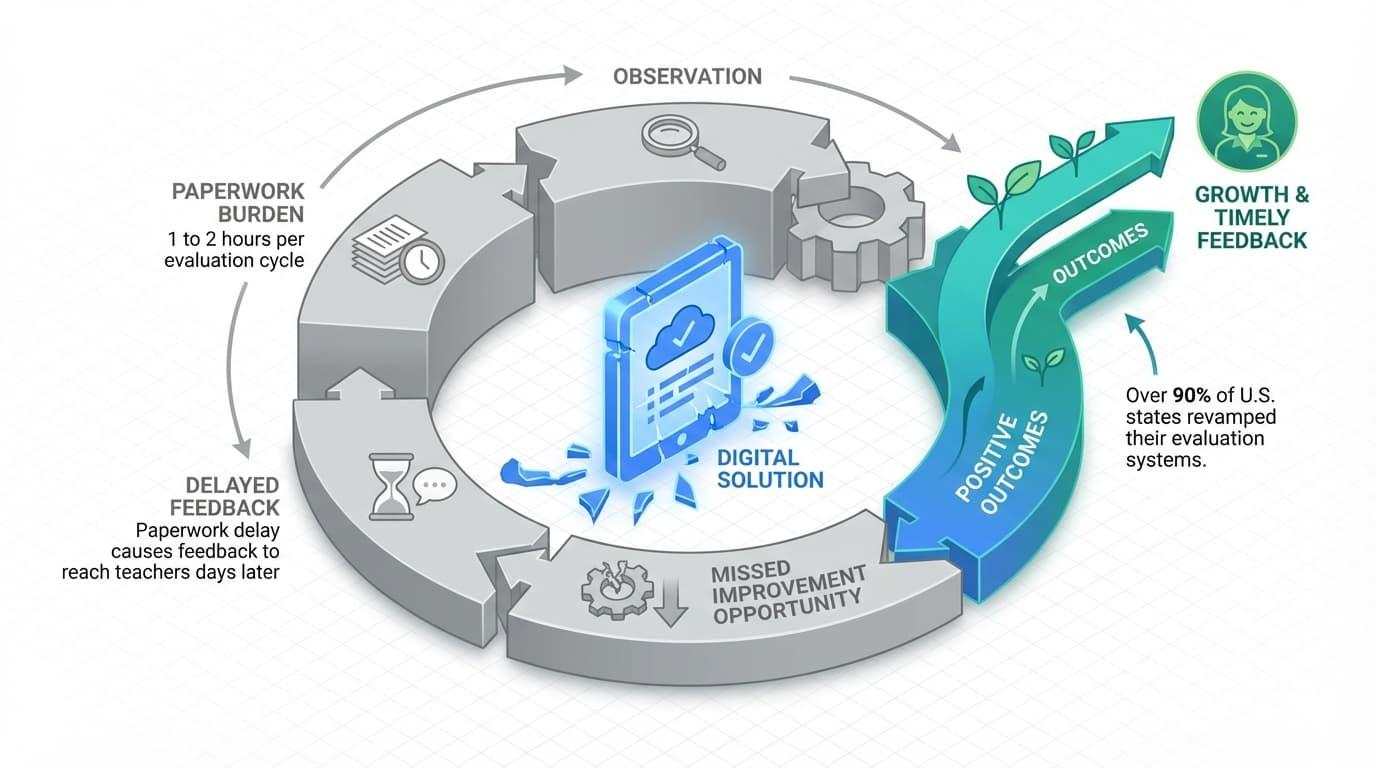
Teacher evaluation frameworks frequently fail because the administrative burden of manual documentation prevents timely feedback.
School administrators typically require 1 to 2 hours per evaluation cycle to conduct walkthroughs, script dialogue, and map evidence to complex rubrics.
Without digital workflow automation, this paperwork delay causes feedback to reach teachers days later, neutralizing the opportunity for real-time instructional improvement.
By lunch, you’ve been pulled into two discipline meetings and a parent call. Your observation notes sit untouched until Thursday.
This is the reality most school leaders navigate. It is exactly why teacher evaluation frameworks often fail to drive the instructional improvement they promise.
A teacher evaluation framework is a structured rubric for defining, observing, and rating effective teaching. Schools typically use these in annual cycles for both development and personnel decisions.
Here’s what the research tells us about how these systems actually work:
- Over 90% of U.S. states revamped their evaluation systems after the 2009 Race to the Top initiative, which tied federal funding to data-driven evaluation models.
- Frameworks like Danielson’s were adopted in more than 20 states by the mid-2010s.
- Research consistently shows that highly effective teachers versus ineffective teachers can generate roughly one additional year of student learning.
The “Widget Effect” is a term from The Teacher Evaluation Project. It describes how 95% to 99% of teachers were rated effective or better in older systems. This pattern persists even in many updated models. When nearly everyone receives the same rating, the process loses its power to drive professional growth.
The goal is not to find a perfect rubric. Instead, you must choose a framework you can realistically use for frequent, timely feedback. The model on your shelf matters far less than the system you build around it.

How to Compare Teacher Evaluation Frameworks as an Observer
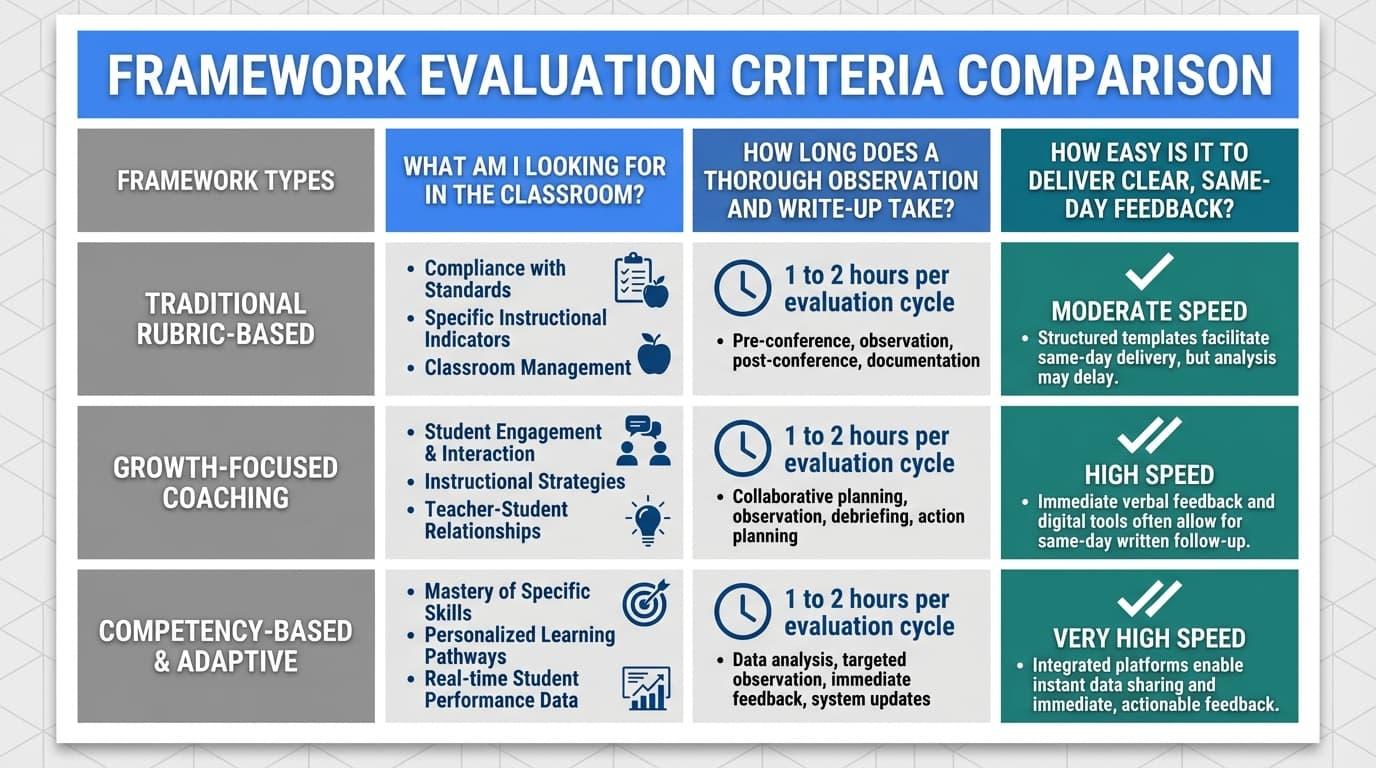
Most framework comparisons focus on domain structures, rating scales, and theoretical underpinnings. That’s useful if you’re selecting a district-wide model. But if you’re the person walking into classrooms every week, you need a different lens.
Let’s compare frameworks based on what they demand from the observer rather than just what they measure. For each model, we will apply three recurring questions:
- What am I looking for in the classroom? This identifies the key indicators and focus areas.
- How long does a thorough observation and write-up take? Helps to measure the time and cognitive load required.
- How easy is it to deliver clear, same-day feedback? This evaluates the practical usability and speed of the model.
Regardless of which category your framework falls into, the implementation challenge remains the same. Comprehensive rubrics typically demand 1 to 2 hours per evaluation cycle without digital tools.
Even simpler models create friction when feedback must travel from your notepad to a teacher’s inbox. This delay slows down the entire observation process and makes it harder for teachers to refine their skills in real time.
Education Walkthrough can host any rubric, including Danielson domains and district-created hybrids. It also provides auto-email feedback summaries, which dramatically reduces the post-observation paperwork burden. But first, let’s understand what each specific framework actually requires from you.
Try Education Walkthrough for free
Framework #1: Danielson Framework for Teaching (FFT)
The Danielson Framework for Teaching is the most widely adopted teacher evaluation model in the United States. It was first published by Charlotte Danielson in 1996 and refined through subsequent editions.
FFT structures effective teaching into four domains:
- Planning and Preparation
- Classroom Environment
- Instruction
- Professional Responsibilities.
These domains are further broken into 22 components and 76 elements.
What Observers Do with FFT
- Conduct both announced and unannounced classroom observations.
- Collect specific evidence (lesson plans, student work, scripted dialogue) aligned to components.
- Rate each component on a 4-point scale: Unsatisfactory, Basic, Proficient, Distinguished.
- Document evidence for professional contributions outside the classroom.
Implementation Realities
- Thorough use often requires 45–60 minutes of observation time plus 30–60 minutes of documentation without digital tools.
- Navigating the FFT’s 22 components creates a significant cognitive load for school administrators, which directly increases the probability of observer bias and documentation fatigue.
- According to a 2024 analysis by the National Council on Teacher Quality (NCTQ), teachers with higher-achieving baseline students receive systematically higher Danielson scores, highlighting inherent student-composition bias.
As Danielson herself has stated, the framework “serves as a tool for common language and shared understanding of what constitutes good teaching.” But that common language requires significant effort to apply consistently.
Bottom line: The Danielson Framework for Teaching is thorough but requires heavy paperwork. Education Walkthrough solves this with built-in, Danielson-aligned forms. It provides instant email summaries, which makes same-day feedback possible even for complex structures.
Try Education Walkthrough Danielson-aligned observation forms today
Framework #2: Marzano Focused Teacher Evaluation Model

The Marzano Focused Teacher Evaluation Model was developed by Robert Marzano in 2017. It is available through the Marzano Evaluation Center, organizing approximately 23 essential teacher competencies into four areas. This represents a significant evolution from earlier Marzano frameworks that included over 60 elements.
Core Observer Focus Areas
- Standards-Based Planning: This involves designing lessons that align directly with specific learning goals. Observers look for clear roadmaps that guide students toward mastery.
- Standards-Based Instruction: This focuses on classroom execution. It includes using engagement strategies, effective questioning, and regular checks for understanding.
- Conditions for Learning: This covers the classroom environment. Observers evaluate the culture, student relationships, and the overall emotional safety of the room.
- Professional Responsibilities: This looks at the teacher beyond the lesson. It includes their commitment to reflection, collaboration with peers, and continuous professional growth.
How Ratings Work
Ratings typically follow a scale from “Not Using” through “Beginning,” “Developing,” “Applying,” to “Innovating.” Each level reflects how well a teacher applies a strategy to impact student learning.
Every element ties directly to observable student effects. These effects include higher success rates and clear evidence of understanding. Because the model defines specific techniques for each competency, the evaluation feels less like a guess and more like a science.
Observation Time and Cognitive Load
- More streamlined than the original 60+ element versions, but still requires detailed scripting of specific strategies during observation.
- Typical full observation plus scoring: 60–90 minutes total for evaluators without extensive training.
- Deliberate alignment to desired effects requires practice and calibration.
Strengths and Trade-offs
The focused teacher evaluation model is highly research-aligned, drawing from meta-analyses of over 100 studies. It provides a specific coaching language.
However, teachers and administrators may perceive it as overly technical without strong training, and paper-based implementation slows feedback significantly.
Case Study: Shrinking the Feedback Gap at Adair Elementary School
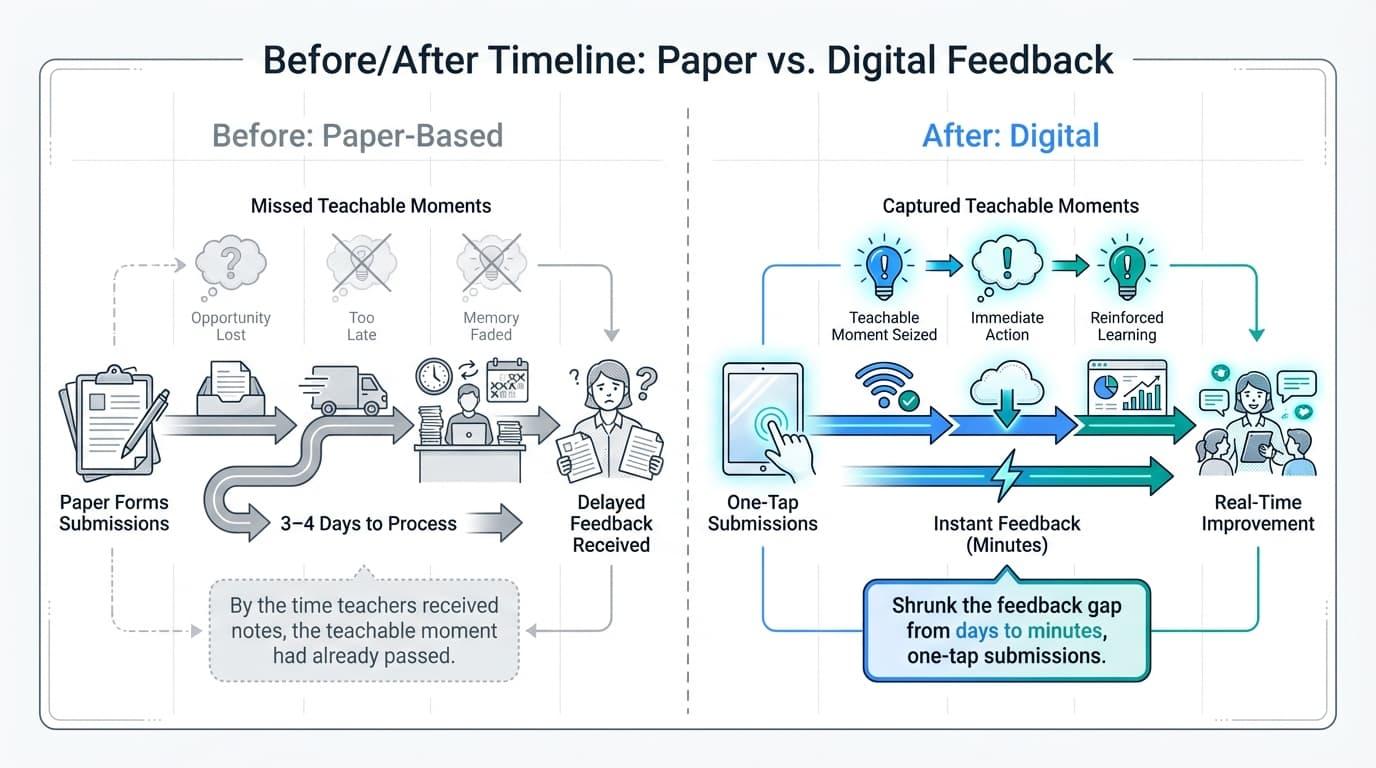
In Adair Elementary, feedback used to take 3–4 days to process via paper forms. By the time teachers received notes, the teachable moment had already passed. Once the school implemented Education Walkthrough, they transformed observation into a real-time growth engine that effectively supports different models of instruction, from reading-block checklists to Kagan strategies.
By using one-tap submissions, the school shrunk the feedback gap from days to minutes. Megan Bell, a teacher at Adair, noted:
“The minute my coach would leave my room, I’d get an email. Previously, it took 3–4 days.”
This shift allowed educators to adjust instructional strategies by the very next period. Because coaches stopped wasting time on clerical re-typing, they could focus on modeling lessons.
At Adair, these instant insights have replaced delayed reports, providing the kind of high-quality data typically only seen at the district level to ensure every instructional minute counts.
Read the Full Adair Elementary School Case Study
Framework #3: Stronge Teacher Effectiveness Performance Evaluation System (TEPES)
James Stronge’s Effectiveness Performance Evaluation System uses a research-based approach built on six key-standards. These include Professional Knowledge, Instructional Planning, and Instructional Delivery. It also covers Assessment, Learning Environment, and Professionalism.
A focus statement for this model might emphasize that teaching quality is too complex for a single metric. By adding Student Learning Objectives (SLOs), the framework includes a clear growth component.
The Evaluator’s Responsibilities
- Evidence Collection: Observers use detailed performance indicators to gather evidence for each standard.
- Data Triangulation: You must combine multiple sources. This includes formal observations, walkthroughs, and documentation logs.
- Final Ratings: Evaluators assign annual summative ratings based on the total body of evidence collected.
Why Districts Choose Stronge
Many state councils adopted Stronge-like systems after 2010. They did this to meet federal requirements for multi-measure evaluations. The model is popular because it integrates well with SLOs. This makes it a strong choice for states looking for alternatives to standard test scores.
Practical Implementation Challenges
Collecting data throughout the year can become logistically complex. If you do it manually, compiling final ratings may take several hours per teacher. You must track artifacts and notes constantly.
The model works best with platforms that let you tag notes to specific standards instantly. This makes managing large caseloads much easier for busy administrators.
Framework #4: TAP/NIET Teaching Standards Rubric
The Teacher Advancement Program (TAP), developed by NIET, is a comprehensive school-improvement model. It combines classroom observation rubrics with student growth measures and performance-based compensation. This framework is built on the idea that better teaching leads directly to better student outcomes.
The Evaluator’s Responsibilities
- Frequent Observations: Leaders conduct three to five rubric-based observations per teacher every year.
- Feedback Conferences: You must lead a detailed conference after every visit to discuss results.
- Coaching Alignment: Evaluation data must link directly to ongoing coaching and professional development.
Rubric Structure and Focus
The rubric is divided into domains like Instruction, Planning, and the Learning Environment. Each domain includes multiple indicators that require specific evidence.
There is a very strong emphasis on high-leverage practices. Observers look closely for student discourse and deep cognitive engagement rather than just teacher activity.
Systems-Level Impact
Case studies from Tennessee and New Mexico show real student achievement gains with this model. Success requires strong leadership buy-in and integrated data systems.
Because the model links evaluation to teacher pay, documentation must be perfect. It requires careful calibration among observers to ensure every rating is fair and accurate.
Important note: TAP works best when the school has protected time for feedback conferences and a digital platform centralizing observation data. Paper-based processes consistently falter under the volume of required observations and documentation.
Framework #5: Value-Added Models (VAMs) for Teacher Evaluation
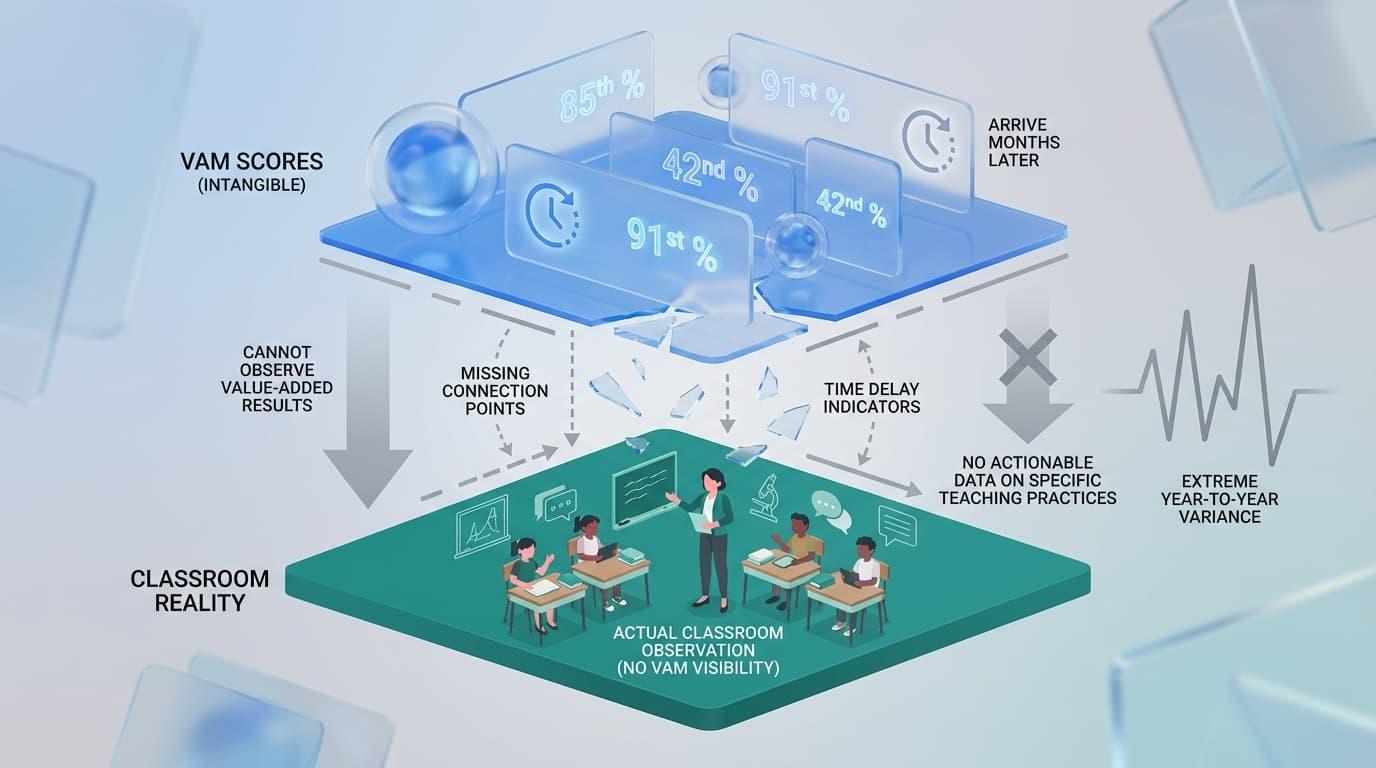
Value-Added Models (VAMs) are statistical tools used to estimate a teacher’s impact on student test scores. These models control for factors like prior achievement, demographics, and school-level variables.
Research from the NBER suggests that VAM scores can be unbiased predictors of future performance on average. However, these scores show extreme volatility from year to year.
Reality for the Observer
- Invisible Metrics: You cannot “observe” value-added results during a classroom visit because VAM is not a rubric.
- Delayed Data: Scores arrive as numerical percentiles months after the school year ends.
- Lack of Context: VAM provides no actionable data on which specific teaching practices need to change.
Critical Risks and Limitations
Because the statistical algorithms powering VAMs are mathematically opaque, single-year student growth scores display high volatility. This extreme year-to-year variance makes VAMs highly unreliable for high-stakes personnel decisions such as tenure or termination.
Most importantly, VAM fails to describe the actual instructional moves that produced the results. It tells you “what” happened, but never “why” or “how” to fix it.
Recommendation: If VAM is required, use it as one supplemental measure among several. Never as the sole basis for measuring teacher effectiveness or making personnel decisions.
Framework #6: State and District-Specific Rubrics (T-TESS, CSTP, 5D-Inspired)
Many states develop their own evaluation rubrics based on major research frameworks. These models reflect local priorities while maintaining high academic standards. They often serve as the official “skeleton” for a district’s evaluation policy.
Texas T-TESS
Texas launched the Teacher Evaluation and Support System (T-TESS) in the mid-2010s to focus on four key domains. These domains include Planning, Instruction, Learning Environment, and Professional Practices. The system is built to align directly with Texas Essential Knowledge and Skills (TEKS) state standards.
The framework emphasizes goal-setting and self-reflection through pre- and post-conferences. It moves away from rigid rating categories to focus on continuous teacher growth.
California CSTP
The California Standards for the Teaching Profession (CSTP) consists of six professional standards. These cover topics like student engagement, learning environments, and subject matter organization. The framework is used for both teacher credentialing and local evaluations with an explicit equity lens.
Many districts hybridize these standards with local indicators to meet specific community needs. This ensures that the evaluation remains relevant to the unique classroom demographics in California.
Build your custom school rubric today!
5 Dimensions of Teaching and Learning
The 5D model emphasizes purpose, student engagement, and curriculum pedagogy. It also looks closely at assessment for learning and the overall classroom environment. Many districts use this model to prioritize observable student learning over simple teacher behaviors.
This student-centered approach shifts the observer’s focus toward how children are actually processing information. It provides a clear lens for evaluating high-leverage instructional practices.
Regardless of the state label, these rubrics share common observer pain points. They often feature complex descriptors that require careful note alignment and hours of documentation.
Most leaders struggle to deliver feedback while the classroom evidence is still fresh. These models work best when paired with tools that streamline evidence capture and reporting in real-time.
Education Walkthrough simplifies this by mapping these complex state rubrics into a mobile-friendly interface. You can capture evidence and sync it to your official framework with just a few taps.
Framework #7: Student Learning Objectives (SLOs)
Student Learning Objectives are teacher-created, standards-based growth goals for students. These usually cover a full school year.
SLOs became popular in the 2010s as a way to measure growth in subjects without standardized tests. The process starts with collecting baseline data to find a starting point for student groups.
Teachers then set SMART goals that are specific, measurable, and ambitious. Throughout the year, they monitor progress leading up to a final period of evidence collection and reflection.
The Evaluator’s Oversight
- Initial Approval: You must review and approve the quality and rigor of each SLO at the start of the cycle.
- Midyear Check-ins: Leaders check progress during midyear conferences to ensure students are on track.
- Final Integration: You incorporate the final SLO results into the teacher’s summative rating alongside observation data.
Strengths and Weaknesses
- Provides flexibility across subjects and grade levels where standardized test scores don’t apply.
- Can promote meaningful instructional planning conversations between teachers and evaluators.
- Quality and rigor vary widely, often turning SLOs into compliance exercises rather than growth targets.
- The paperwork burden is heavy without workflow tools for tracking and documentation.
Treat SLOs as a structured coaching tool rather than a bureaucratic add-on. Simple digital forms and shared progress dashboards can transform SLOs from paperwork into actual conversations about student progress.
Framework #8: Student Evaluation of Teaching (SET) and 360-Degree Feedback
Student surveys and 360-degree feedback gather input from students, peers, and families. This data captures parts of teaching that a single observation might miss. It provides a broader look at the classroom experience over a long period.
Benefits of SETs
- Multiple viewpoints can increase the perceived fairness of the evaluation.
- Student feedback highlights daily classroom climate and student-teacher relationships.
- Surveys can be administered at scale with very little time from the observer.
- Consistent data over time helps identify patterns in student engagement levels.
- Feedback from peers can offer deep insights into a teacher’s subject matter expertise.
What the Observer Evaluates
In this model, your primary job is to analyze the data for trends. You look for gaps between your observation notes and the students’ reported experiences.
For example, a teacher may appear organized during your visit, but students might report confusion about daily assignments.
You use these insights to guide coaching conversations. This approach moves the focus from a single “snapshot” to a film of the entire school year.
Addressing Data Bias and Risks
While helpful, these surveys carry significant risks. Research shows documented bias based on teacher gender and race.
Female teachers often receive higher marks for warmth but lower scores for academic challenge. Minority teachers frequently receive lower overall scores than their peers, regardless of performance.
Student responses can also be swayed by how “easy” a class is or how a teacher grades.
Anonymous surveys sometimes lead to extreme or negative responses that do not reflect the true classroom reality.
Because of these factors, bias in evaluations can distort results. It can easily lead to poor management decisions if used alone.
Recommendation: Use surveys mainly for formative insights and trend data. They should never be the main driver for high-stakes decisions like hiring or firing. Instead, treat them as a conversation starter.
Platforms like Education Walkthrough help you compare this perception data with your own concrete observation evidence. Having both in one place provides the context you need to interpret student feedback fairly.
Framework #9: The Great Teaching Toolkit (Evidence-Based Education)
The Great Teaching Toolkit (GTT) was released in the 2020s by Evidence-Based Education. It synthesizes over 100 studies into four core dimensions of great teaching.
- Understanding the Content: Teachers must have deep subject knowledge. They also need to understand exactly how students learn that specific material.
- Creating Supportive Environments: This focuses on building strong relationships and high expectations. It ensures the classroom climate is safe for learning.
- Maximizing Learning Opportunities: This prioritizes time on task. It involves using efficient routines to keep students engaged throughout the period.
- Activating Hard Thinking: This is the most critical dimension. It focuses on cognitive challenges and deliberate practice to push student understanding.
Unlike traditional rubrics, GTT acts more as a roadmap for professional growth. It offers competency maps and diagnostic tools for self-assessment and coaching. This design avoids punitive ratings to focus on developmental pathways for every educator.
The Evaluator’s Role in Coaching
- Coaching-First Mentality: The focus shifts from formal summative assessment to meaningful coaching conversations.
- Adaptable Walkthroughs: The framework is flexible enough to be adapted into short, custom walkthrough forms.
- High-Leverage Indicators: This model supports frequent, brief visits that look for specific indicators of student thinking.
The Evidence Behind the Model
The dimensions in this toolkit are tightly linked to student-learning research. Each area includes explicit effect sizes to show how much it impacts student outcomes.
For example, cognitive activation shows a very high impact on learning. These clear links give leaders confidence that their feedback will actually improve results.
GTT works best when leaders prioritize short walkthroughs with fast feedback. It is most effective when supported by a platform that handles custom rubrics and tracks growth over time.
Framework #10: Informal Walkthrough Rubrics and Hybrid Models
Many school districts now run hybrid systems. They pair a formal framework, like Danielson, with a simpler, custom walkthrough tool. This tool focuses on a limited set of high-leverage practices to support teachers’ professional growth.
Typical focus areas include ensuring learning objectives are clearly posted and referenced. Observers look for checks for understanding embedded throughout the lesson. They also check if student engagement tasks require real thinking rather than just compliance.
Finally, these walkthroughs often include sample instructional techniques that highlight a positive classroom culture.
Benefits for Busy Leaders
Shorter forms significantly reduce the cognitive load during classroom visits. Because the forms are concise, five to fifteen-minute visits allow for much more frequent feedback cycles.
Same-day documentation becomes a realistic goal rather than a burden.
Research from UPenn suggests that rolling averages from these frequent visits are highly effective. They help mitigate the volatility often found in single-visit snapshots. This approach provides a more accurate picture of daily instruction.
Critical Implementation Boundaries
- Walkthroughs alone should not drive high-stakes employment decisions.
- Every indicator used must have an explicit alignment back to the district’s formal framework.
- Teachers need clear communication about how these informal visits connect to their final summative evaluation.
- Observers must ensure they visit at different times of the day to avoid a biased sample of instruction.
- Without a structured schedule, leaders may unintentionally overlook certain departments or grade levels.
Education Walkthrough is designed precisely as this hybrid layer. It translates any formal framework into quick, mobile-friendly observation tools. You get automatic feedback summaries that stay perfectly aligned with your required evaluation model.
Choosing the Best Teacher Evaluation Framework for Your School
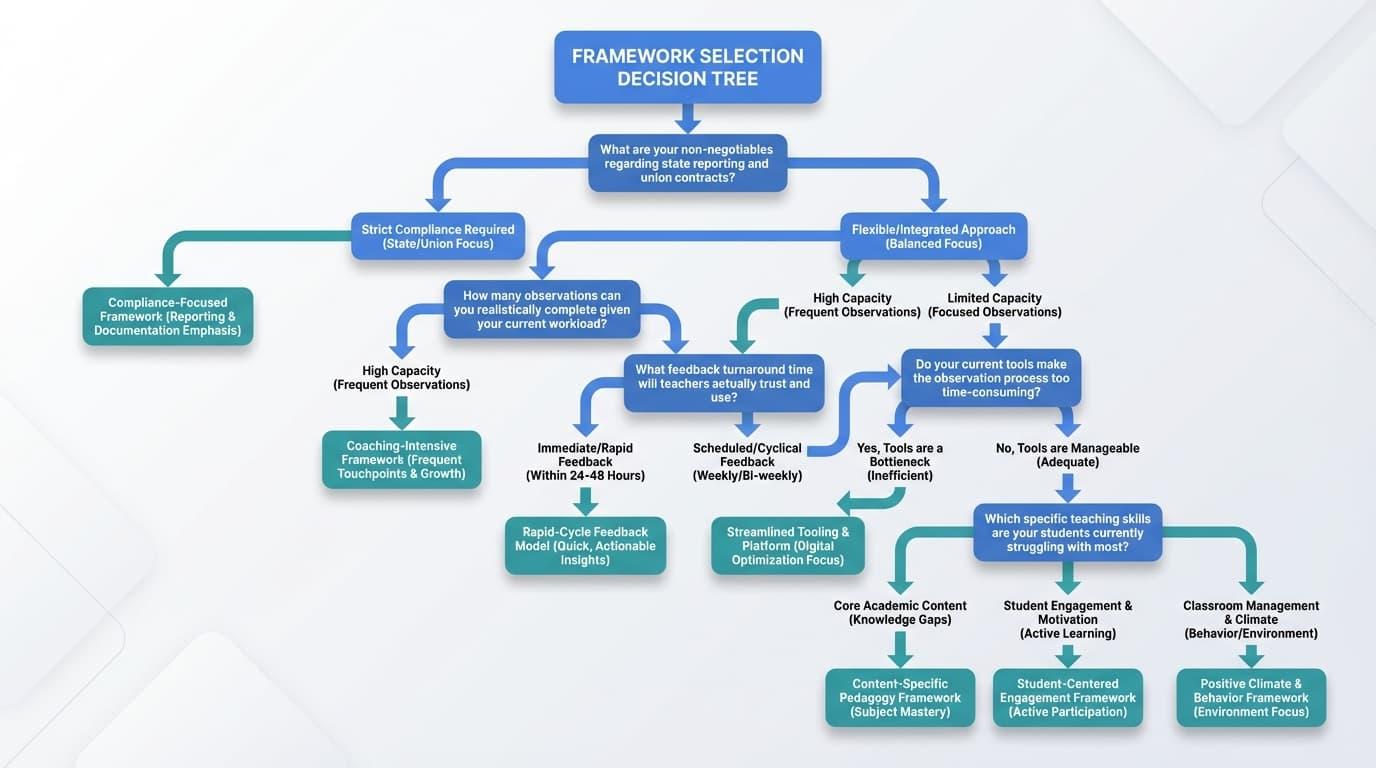
Most leaders cannot freely choose their primary evaluation model due to state mandates, district requirements, and union agreements. However, you can shape how that framework is implemented and choose the supplemental tools that support it. Your goal is to move beyond mere compliance to truly impact a teacher’s practice.
What Should You Ask Before Choosing?
- What are your non-negotiables regarding state reporting and union contracts?
- How many observations can you realistically complete given your current workload?
- What feedback turnaround time will teachers actually trust and use?
- Do your current tools make the observation process too time-consuming for your team?
- Which specific teaching skills are your students currently struggling with most?
- Does your current rubric allow you to see the desired effect of a lesson on student engagement?
What the Evidence Tells Us
Research shows that the quality, frequency, and timing of feedback drive instructional shifts more than specific rubric labels. Frameworks must be paired with active coaching and professional learning to empower teachers.
Evaluation alone is rarely enough to change daily habits. To get an accurate picture, you should use multi-year data averaging. This helps account for the natural year-to-year volatility found in any single measurement or practice.
Tips for Making a Choice
- Align Your Tools: Ensure any supplemental tools match your state rubric to avoid duplication and confusion.
- Build Teacher Buy-In: Involve your staff in adapting indicators to your school’s unique context.
- Start with a Pilot: Test simplified walkthrough versions before attempting a full-scale implementation change.
- Focus on Accessibility: Choose a platform that allows you to record evidence on the go without carrying heavy laptops.
- Prioritize Actionable Data: Select a model that generates clear reports so teachers know exactly what to change tomorrow.
The Final Mindset Shift
Treat your mandated framework as the skeleton. Your implementation system—the observation schedule, feedback tools, and connected development—is the muscle that actually moves the needle.
Making Any Framework Work: Systems, Tools, and Time
No framework can fix observations that are rushed, infrequent, or buried in paperwork. The specific model you choose matters. However, building a system where observers visit classrooms often matters more. Feedback must return to the teacher quickly to be effective.
As UPenn’s Matthew Steinberg has noted: “If these indicators are going to factor into a rating that might affect teacher pay, promotion, or job security, then some tweaks might be needed—like using a rolling average over several years to help even out swings in performance due to classroom composition.”
The same logic applies to daily implementation: single snapshots become meaningful when they’re part of a pattern, not isolated events.
Smart Strategies for Implementation
- Prioritize observation schedules that favor frequency over length.
- Conduct ten short visits instead of two long, high-stakes sessions.
- Use common observation forms that every leader in the building uses consistently.
- Protect specific time for feedback conversations rather than squeezing them between meetings.
The Problem with Manual Tracking
- Evidence Capture Gaps: It is difficult to record rich evidence in real-time while using paper or static spreadsheets.
- Data Aggregation Hurdles: Hard copies make it nearly impossible to see trends across different grades or schools.
- Feedback Delays: As your caseload increases, the gap between the observation and the feedback grows too wide.
The Power of Digital Platforms
- Mobile Alignment: Mobile forms aligned to rubrics like Danielson keep your evidence capture focused and fast.
- Instant Summaries: Automated email summaries close the feedback loop within hours rather than days.
- Trend Dashboards: Visual data boards help you identify system-wide professional development needs instantly.
- Evidence Organization: Digital tools allow you to attach photos or video clips directly to specific rubric indicators.
- Historical Tracking: You can easily view a teacher’s growth over several months to see if coaching is actually working.
Your value as an instructional leader is not found in filling out rubrics. It is found in creating fast, focused coaching cycles. These cycles should support teachers in their day-to-day practice.
Common Risks and Myths in Teacher Evaluation
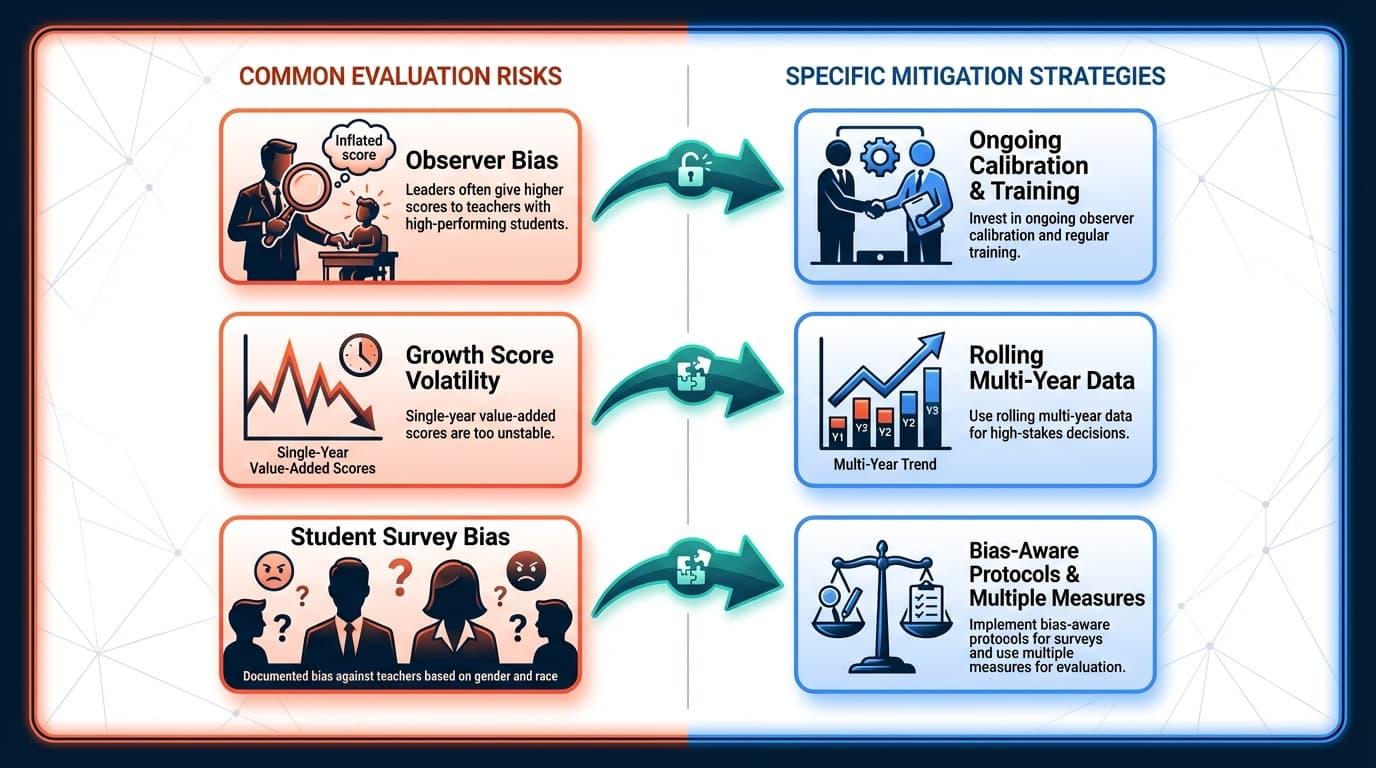
Even the “best” frameworks can backfire if leaders ignore known risks and persistent myths documented in recent education research.
Some risks and myths include:
- Observer Bias: Leaders often give higher scores to teachers with high-performing students, regardless of the teacher’s actual performance.
- Growth Score Volatility: Single-year value-added scores are too unstable to be used for high-stakes decisions like termination.
- Student Survey Bias: Feedback from students shows documented bias against teachers based on their gender and race.
- The Rubric Myth: Adopting a new rubric does not improve teaching on its own; high-quality feedback is the active ingredient.
- Complexity Issues: Adding more rating categories reduces reliability and rarely provides more actionable information for the teacher.
Mitigation Strategies That Work
- Build effective systems using a multi-measure approach with clear weighting.
- Use rolling multi-year data for high-stakes decisions instead of single-year snapshots.
- Invest in ongoing observer calibration and regular training to ensure fairness.
- Be transparent with teachers about how different evidence sources are used.
- Focus on specific instructional growth goals rather than just final ratings.
- Schedule regular “calibration walks” where multiple leaders observe the same lesson.
Frameworks should provide guidance for professional growth, not just justify personnel actions. A healthy culture of feedback is more predictive of student achievement than the exact structure of any evaluation model.
Frequently Asked Questions
Have questions? Our team at Education Walkthrough can guide you with the answers you need.
What is the single most important factor when choosing a teacher evaluation framework?
The most important factor is usability within your specific school context. You must choose a framework that allows for frequent visits and timely feedback. While you must follow state mandates, practical implementation is what actually drives real growth in the classroom.
How many classroom observations per year actually improve teaching?
Research suggests that conducting six to ten short visits per year is most effective. Frequent, low-stakes observations paired with coaching create stronger instructional shifts than one long annual meeting. The key is providing specific, high-quality feedback within forty-eight hours of every visit.
Should student test scores be part of teacher evaluation?
Test scores provide one piece of the puzzle, but should not be the sole measure. Research warns that single-year growth data is often too volatile for high-stakes decisions. Use scores alongside observations and surveys to identify broad patterns in student achievement.
How can we reduce bias in classroom observations?
Reduce bias by holding regular calibration sessions and using clear, behavior-based indicators. Schedule visits at different times of the day to get a fair sample. Using structured digital tools also helps observers stay objective by anchoring every rating in specific classroom evidence.
What should I do if my district’s mandated framework feels too complex?
Create simplified walkthrough forms that map back to the primary framework’s domains. This allows you to focus on high-leverage “look-fors” during short visits without feeling overwhelmed. A digital platform can then roll this evidence up into the formal, required summative evaluation.