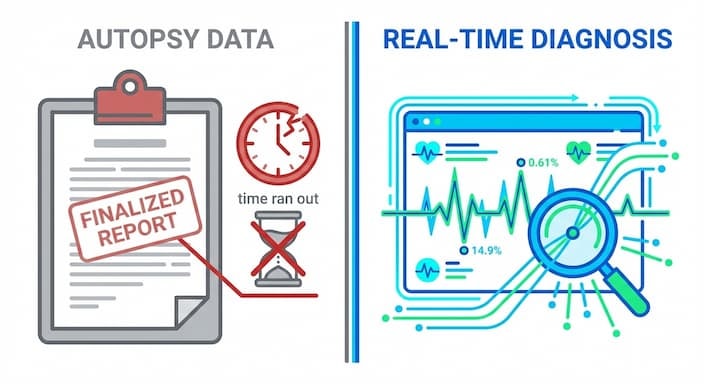
Test scores are often called ‘autopsy data’ because they arrive months after instruction has ended, making them useless for immediate intervention.
In contrast, real-time diagnostic data—gathered through classroom walkthroughs and formative assessments—allows educators to identify and fix learning gaps while students are still in the classroom.
This guide explains how to shift from reactive testing to proactive diagnosis.
Key Takeaways
- State test scores are like an autopsy. They come months after teaching has ended, offering no chance to help the students who struggled. The 2024 NAEP results showed 30-year lows in reading, and achievement gaps are now 36% wider than before the COVID-19 pandemic.
- In contrast, classroom observations and walkthrough data act like early warning signs. They help identify problems while there’s still time to intervene. Research shows that tools such as the Framework for Teaching can accurately predict end-of-year performance when used as early as October and January.
- A randomized controlled trial in Brazil found that combining classroom observations with coaching led to clear student gains (an increase of 0.04–0.23 standard deviations) within a single school year, at a cost of only $2.40 per student.
- Improving the inputs—specifically teaching practices measured through walkthroughs—directly leads to improved outputs in the form of higher test scores
Why Are State Test Scores Called “Autopsy Data”? for Schools
State test scores are referred to as ‘autopsy data’ because they provide a post-mortem analysis of performance long after the opportunity for intervention has passed. The typical timeline creates a 3-4 month lag: tests are administered in April/May, but full reports are not released until September.By this time, struggling students have already moved to new grades, and the data describes a ‘patient’—the student’s prior learning state—that no longer exists in that context.
Here’s the typical timeline:
- April to May: State tests are given
- June to August: Preliminary results trickle in
- September to October: Full reports are released
By then, the students have moved on. The fourth grader who struggled is now in fifth grade with a new teacher. Schedules are locked. Staffing decisions were made months earlier. The window for timely support has already closed.
This is why test scores are often referred to as “autopsy data.” They describe what happened but cannot change the outcome. Like an autopsy, they tell us what went wrong, but only after it is too late to fix it.
The 2024 NAEP results paint a clear picture:
- Reading scores for fourth- and eighth-graders fell to their lowest levels in 30 years.
- Students in the 10th percentile had the worst performance ever recorded.
- Achievement gaps widened: Reading gaps grew by 36 percent compared to pre-COVID, and math gaps grew by 18 percent.
According to a 2024 analysis by the NWEA, students now require 4.8 additional months of reading instruction to catch up to pre-pandemic levels.
While test scores still matter for accountability, their delayed timing makes them ineffective for instructional decision-making. The feedback comes after the moment has passed, when teachers no longer have access to the students who need help.
That is why many schools are rethinking their data strategy and shifting to real-time classroom insights that enable faster action and better support.
How Does Observation Data Act as a Leading Indicator?
If you want to improve student outcomes before the school year ends, test scores are not enough. They arrive too late to help the students who took them. Classroom observation is different. It gives leaders real-time insight into what is happening now and where support is needed.
Empirical data confirms that early-year classroom observation scores are strong predictors of end-of-year state assessment performance.
- Framework for Teaching (FFT): Observation scores across 1,296 lessons predicted year-end gains in reading and math.
- CLAC: In Pre-K classrooms, observation-based responsiveness led to 0.30 to 0.34 standard deviation gains in math and literacy.
- CLASS-Secondary: In high school classrooms, support levels accounted for 5-13 percent of the variation in student achievement.
You don’t need to wait for low scores to act. By November, walkthrough data can show which classrooms need support.
In our analysis of district data using the Education Walkthrough platform, we found that digital timestamps and automated trend reporting allow leaders to capture key indicators—like talk time and feedback quality—without the administrative burden of paper forms.
These insights help schools catch problems early, before students fall behind or end up in remedial classes.
Observation data is one of the most effective tools public schools can use to close achievement gaps, raise graduation rates, and keep students on grade level. But it only works if schools use it consistently and respond in time.
Gold-Standard Evidence: Does Combining Observation with Coaching Improve Student Scores?
Observation is helpful, but real gains come when it is paired with timely and specific coaching. A large randomized controlled trial in Brazil demonstrated this clearly.
Researchers assigned 350 secondary schools to two groups. One group received regular classroom observations and expert coaching via video calls. The other group continued with no changes.
The results were significant:
- Test score gains between 0.04 and 0.09 standard deviations
- Gains up to 0.23 standard deviations in schools that fully implemented the model
- Cost per student was just $2.40
- Participation rate was 85 percent
These results matched or exceeded the impact of more expensive strategies, such as reducing class sizes or overhauling the curriculum.
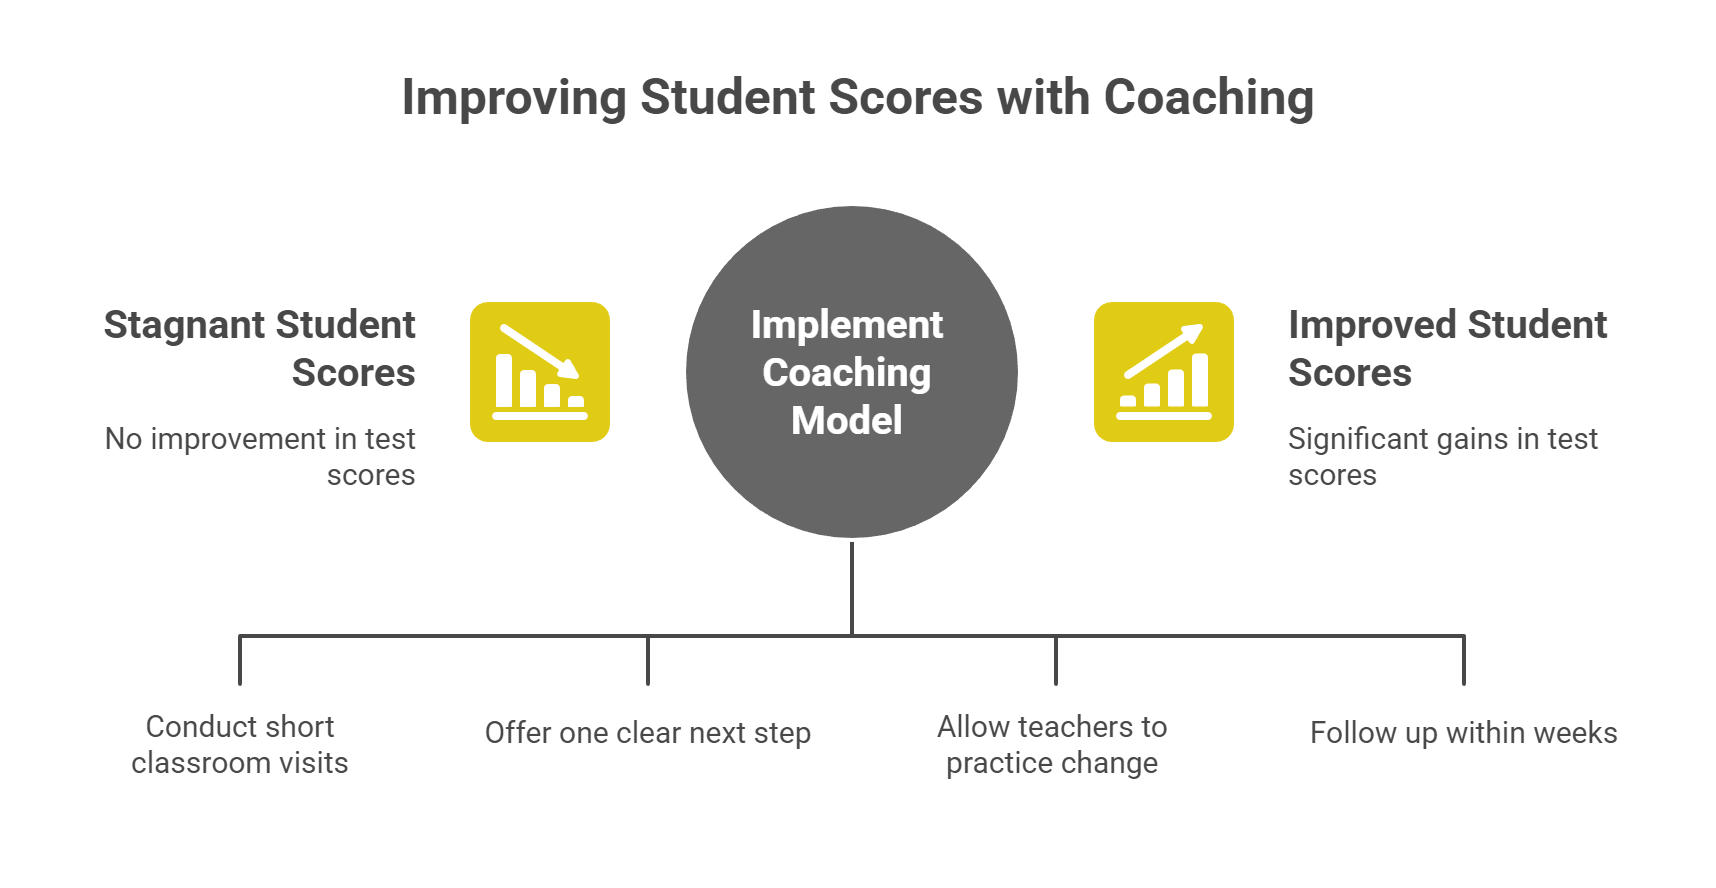
For US school leaders, this shows that a clear cycle of observation, feedback, and follow-up can move student performance within the same school year.
Key practices from the Brazil model:
- Conduct 20-minute classroom visits
- Offer one clear, actionable next step
- Allow teachers to practice the change with support
- Follow up within two to three weeks
This approach does not require costly programs. It just needs structure, consistency, and a focus on professional growth.
How Do Real-Time Data Systems Identify Learning Gaps Early?
Too often, schools wait until summer to discover problems they could have spotted in the fall. By the time state test scores arrive, it is months too late to support the students who needed help in October.
Instead, schools using real-time data systems can catch learning gaps early. Research shows these schools are about 28% better at identifying struggling students before they fall behind. That early insight allows teachers to intervene and avoid the need for remedial classes later.
Quarterly benchmarks, especially when aligned with state standards, act as strong predictors of end-of-year performance. These nine-week assessments give teachers the chance to reteach skills within days, not months. It is the difference between staying on track and playing catch-up.
Take this example from a mid-sized district:
| Month | Assessment Type | Walkthrough Focus | Intervention Timeframe |
| September | Diagnostic baseline | Lesson structure, objectives | Establish routines |
| November | Benchmark 1 | Checks for understanding | 6 weeks before next benchmark |
| February | Benchmark 2 | Engagement and feedback | 8 weeks before state test |
| April | Final benchmark | Test-taking habits | 2 to 3 weeks of targeted review |
When walkthrough data is combined with assessment results, leaders can quickly spot patterns. If the November math benchmark shows low mean scores in 5th-grade fractions, principals can look at walkthroughs. Are teachers using visual models? Is there enough guided practice? Are math blocks being shortened?
With tools like Education Walkthrough, schools can:
- Time-stamp every classroom visit
- Track what was observed
- Compare across subjects, grades, and weeks
- Spot early signs of low performance
Sample Data Calendar:
- Weekly: 3 to 5 classroom walkthroughs per admin
- Monthly: Review walkthrough trends with PLCs
- Quarterly: Analyze benchmark scores and reteach where needed
- Ongoing: Use dashboards to monitor at-risk students
The point is simple: real-time data turns each week of the school year into an opportunity to guide instruction. It helps teachers support students long before exams. It also gives parents and principals enough time to act. Most states now provide the tools. What is needed is the commitment to use them.
As the Fordham Institute and others have noted, comparing apples to apples requires using current, actionable data rather than waiting until the end to understand what went wrong.
How Should Principals Design an Effective Walkthrough Schedule?
An effective walkthrough schedule must balance high frequency with immediate, actionable feedback to drive score improvements. Research indicates that a ‘compliance’ model—one or two formal visits per year—yields no meaningful gains in student achievement. Conversely, a schedule of 6–10 short, unannounced visits per year, paired with feedback delivered within 24 hours, creates a cycle of continuous improvement. Without this frequency-quality balance, observations remain a bureaucratic exercise rather than an instructional lever.
What research says about effective frequency:
- Minimum: At least five walkthroughs per teacher per year, in addition to formal evaluations
- Effective range: 6–10 visits per school year
- Intensive support: Around 18 trips per year in high-priority grades or subjects
But quantity alone is not enough. A study in Tennessee examined about 80% of districts and compared schools that required one vs. two formal observations per year; the results showed no meaningful gains in student achievement.
Why didn’t it work?
- Only 18% of teachers received pre-observation conferences
- 40% said the feedback was hard to use
- The average observation lasted just 15 minutes
- Follow-up or coaching was rare
This wasn’t instructional leadership. It was compliance.
A better approach includes:
- Unscheduled 20-minute observations in different classrooms each week
- Immediate, focused feedback with one clear action step
- Teachers practice the change right away or soon after
- A follow-up visit within 2–3 weeks to check progress
Sample schedule for a principal:
- 3 classroom visits per day, 4 days per week = 12 visits weekly
- In a school with 40 teachers, each teacher is seen every 3–4 weeks
- Each visit includes 20 minutes of observation and 5 minutes of feedback
- 1 hour weekly to review trends and plan next steps
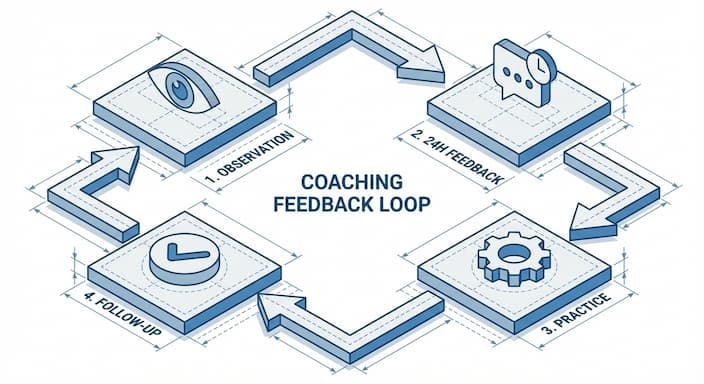
A high-quality walkthrough system adheres to five core operational standards:
- Duration: Administrators conduct observations lasting a minimum of 20 minutes.
- Frequency: Each teacher receives 6–10 visits per academic year.
- Timeliness: Leaders deliver feedback within 24 hours of the visit.
- Focus: Each visit results in exactly one focused action step.
- Review: Leadership teams review aggregated data monthly.
When walkthroughs are consistent and purposeful, they stop being a checkbox. They become the system that helps teachers grow and students succeed before the end of the year.
Why Test Scores Fail as Your Primary Metric of School Quality
State tests have a place in education. They help monitor long-term trends, provide accountability across states and countries, and flag achievement gaps. But using test scores as the primary measure of school quality leaves out too much of the story.
These assessments offer only a narrow snapshot. They often arrive months after the school year ends, long after teachers can respond. They also report students’ performance on a single day rather than what they learned over the year.
The Limitations of Standardized Testing Metrics
Despite their visibility, state test scores do not capture the complete picture of teaching or learning. Here’s what they leave out:
- Student motivation and persistence: Research shows these matter more for long-term success than most test scores. Yet they go unmeasured.
- Depth of learning: Most tests sample only a few questions per standard. This weakens diagnostic accuracy and makes it hard to pinpoint where students actually need help.
- Curriculum breadth: When only specific subjects are tested, others get less attention. This narrows learning and can hurt engagement, especially in high school and senior year.
- Teaching quality: Test results reflect much more than instruction. Socioeconomic status, prior achievement, and access to resources all affect scores. A great teacher working with students two grade levels behind might still show low scores, even with strong growth.
As W. James Popham of the Fordham Institute once said, using test scores to measure school quality is like “measuring temperature with a tablespoon.” The tool doesn’t match the task.
The Real Impact of Overreliance on Test Scores
If test-based accountability were enough, we would have seen different results by now. But the 2024 NAEP results showed widening gaps in reading and math since the pandemic began. Many students, especially those at the 10th percentile, are still behind.
It’s not that tests don’t matter. They do. But using them as the primary tool for improvement is like comparing apples to oranges. The average test score tells us nothing about the teaching methods, classroom environment, or daily learning experiences that led to it.
What State Tests Can and Cannot Tell You
They can tell you:
- Whether students met grade-level expectations on one assessment
- Gaps between groups, such as English learners or economically disadvantaged students
- Trends over time compared to the previous year or other districts
They cannot tell you:
- Why did students miss key concepts or perform below the mean score
- How to adjust instruction during the school year to help
- Whether a specific teaching strategy is working
- Which skills students lacked, and how long they were behind
- Whether teachers are growing or receiving meaningful support
- Whether a school is helping improve graduation rates or preparing kids for college
Moving Toward Better Data
Schools need more than once-a-year scores. They need continuous feedback that reflects how learning is actually happening. This might come from walkthroughs, formative assessments, student work samples, or even simple paper-and-pencil checks.
That kind of information shows whether students are truly mastering the content. It also helps parents and leaders know when to step in, weeks, not months, before final exams.
State education departments, especially in most states, need to rethink how they support schools. That means building systems that reward early action, support strong teaching, and honor what actually helps kids grow.
How Do Data Inputs Compare to Outputs in Predicting Success?
If you’re a principal or superintendent trying to boost student performance, not all data is equally valid. Some data helps you act quickly. Some arrive too late to make a difference.
Here’s how the most common data sources compare:
- State Test Scores: These are released after the school year ends. That means you can’t change anything for the students who have already taken them. Trying to improve next year’s results using last year’s data is like comparing apples to oranges.
- Quarterly Benchmarks (Formative Assessments): Administered every 9 weeks, these provide teachers with time to reteach key concepts. They align with state standards and can predict end-of-year performance when used correctly. Most states already offer this type of testing.
- Real-Time Analytics: These tools track student progress on a weekly or monthly basis. Research shows that schools using real-time data identify struggling students 28% faster than those relying solely on end-of-year scores. Early detection means earlier support.
- Classroom Observation Data: Walkthroughs and in-class observations are the most immediate and valuable data. You can see what’s working and what’s not—right now. And you can act on it the same day. This is your most powerful input.
If you improve the inputs, like instruction, engagement, and support, you’ll almost always see better test scores later.
Action Plan for Principals and Superintendents Facing Spring Testing
If you are a principal or superintendent seeking to improve instruction before spring testing, the shift must start now. Waiting for end-of-year results keeps schools in reaction mode. This plan focuses on building systems that support teachers throughout the school year, when change still matters.
Year 1: Build the Foundation
Start by selecting a consistent, easy-to-use observation tool. This could be:
- A district-created rubric
- A Framework for Teaching-aligned form
- A ready-made template from Education Walkthrough
Train principals and assistant principals to focus on two or three high-impact teaching practices. Schedule at least 5–7 walkthroughs per teacher throughout the school year. Prioritize high-leverage areas like third-grade reading, middle school math, and key high school courses.
At the same time, launch quarterly formative assessments aligned to state standards. Use a shared spreadsheet, dashboard, or Education Walkthrough to log and review trends in classroom practice. Hold monthly leadership reviews to respond to early patterns with coaching and support.
Year 2: Increase Frequency and Quality
With systems and routines in place, raise the number of walkthroughs to 10–12 per teacher, especially in core subjects. Ensure each visit lasts at least 20 minutes and ends with one actionable step delivered within 24 hours.
Tie observation feedback directly to PLC discussions and professional learning goals. Begin tracking whether teachers apply suggested strategies. Use formative assessment data to determine which classrooms may need more frequent support.
Education Walkthrough helps simplify this stage by organizing walkthrough notes, timestamping feedback, and making trends easy to track—saving leaders time and improving consistency across schools.
Year 3: Make It Part of the Culture
By year three, walkthroughs should feel routine, supportive, and clearly tied to growth. Leaders should position them as tools for professional development, not evaluation.
Use aggregated data from observations to shape school-wide PD plans. Protect principal time for classroom visits. Encourage teachers to request feedback and share ideas that work.
At the district level, connect walkthrough trends to student outcomes. Use that data to highlight best practices across schools and recognize teams or teachers showing growth. With tools like Education Walkthrough, leaders can maintain momentum by scaling what works and making feedback a core part of the school culture.
Communicating the Shift
When talking with teachers and school boards, focus on a simple message: improving instruction early prevents surprises later. Share evidence, including research showing that regular observation paired with coaching leads to measurable gains within one school year.
Be clear that walkthroughs are about growth, not surveillance. This shift requires focus and political courage, mainly when instructional time competes with administrative demands.
When leaders are held accountable for walkthrough completion and feedback quality, behavior changes. Tools like Education Walkthrough make this easier by helping schools stay consistent, timely, and aligned without adding extra work.
Conclusion
Raising student achievement does not begin with standardized test scores. It starts earlier, inside classrooms, with what teachers do each week and how schools respond in real time. When a school district builds systems around classroom observation, feedback, and timely intervention, it supports growth long before standardized test results are available.
This approach is not just about collecting data. It is a shift in how the educational system supports teachers through meaningful professional development and coaching. Acting on early signs helps low-performing students receive support before scores fall, not after.
Education Walkthrough supports this shift by giving leaders an easy way to capture classroom observations, share consistent feedback, and turn everyday visits into insight. With the right process in place, schools can stop reacting to raw scores and start creating the conditions for better outcomes—for every teacher, every test taker, and every student.
Frequently Asked Questions
Have questions? We’re happy to help!
If test scores are lagging indicators, should we ignore them?
No. Test scores still matter for accountability, equity, and tracking long-term progress across schools and states. The key is not to rely on them the same way for daily decisions; instead, combine them with real-time classroom data to support students before low scores appear.
How can we avoid walkthroughs feeling punitive to teachers?
Separate walkthroughs from formal evaluations and make the purpose clear: growth, not judgment. Teachers are more likely to participate when they see walkthroughs as support for better teaching, not as surprise exams.
What tools or platforms are best for collecting observation data?
You can start simple with paper and pencil or shared Google Forms. As your system grows, tools like Education Walkthrough help organize notes, analyze trends by grade and subject, and track improvements in scores across weeks and school years.
How do we build time for 6 to 10 walkthroughs per teacher into a full schedule?
Protect time on your calendar for instructional leadership, just like any meeting. For example, 90 minutes per day can cover 3 classrooms and help surface real learning issues before they show up in test data.
What evidence can I share with my school board to justify investing in walkthrough systems?
Share the Brazil study as one example: up to 0.23 standard deviation gains for under $3 per student. You can also cite research from the Fordham Institute showing that consistent coaching improves assessment results more effectively than new curriculum purchases or one-time test prep.