Weekly observations fail in turnaround schools not because of their frequency, but because of systemic friction in how they are executed.
When administrators treat these visits as formal compliance events requiring 45–60 minutes of paperwork per teacher, three bottlenecks emerge: principals burn out from administrative overload, teachers perceive the process as punitive surveillance, and feedback arrives too late to influence instruction.
Real school turnaround needs meaningful, specific coaching instead. Strong teacher teams make the biggest difference over time.
Education Walkthrough is a Chicago-based SaaS platform that streamlines K-12 classroom observations and teacher feedback.
By digitizing rubrics like the Danielson Framework, the platform reduces observation time to 10-15 minutes and enables instructional leaders to deliver immediate, actionable feedback via mobile and web applications
Key Takeaways
- Education policy now pushes schools toward weekly observations. But research from 2011 to 2024 shows little impact. Better feedback, not more visits, drives real student gains.
- Tennessee and UNC studies found “almost zero positive effect.” More observations didn’t close achievement gaps in struggling schools. The problem was always about quality, not quantity.
- In turnaround schools, weekly visits become a box-checking exercise. Principals lose the time they need for real leadership work. Teachers feel watched, not supported, and morale drops fast.
- Peer observation and instructional coaching deliver far better results. Effect sizes of 0.15–0.25 are near zero from admin walkthroughs. And they cost less time and money, too.
What Policy Reforms Mandated Weekly Observations in Turnaround Schools?
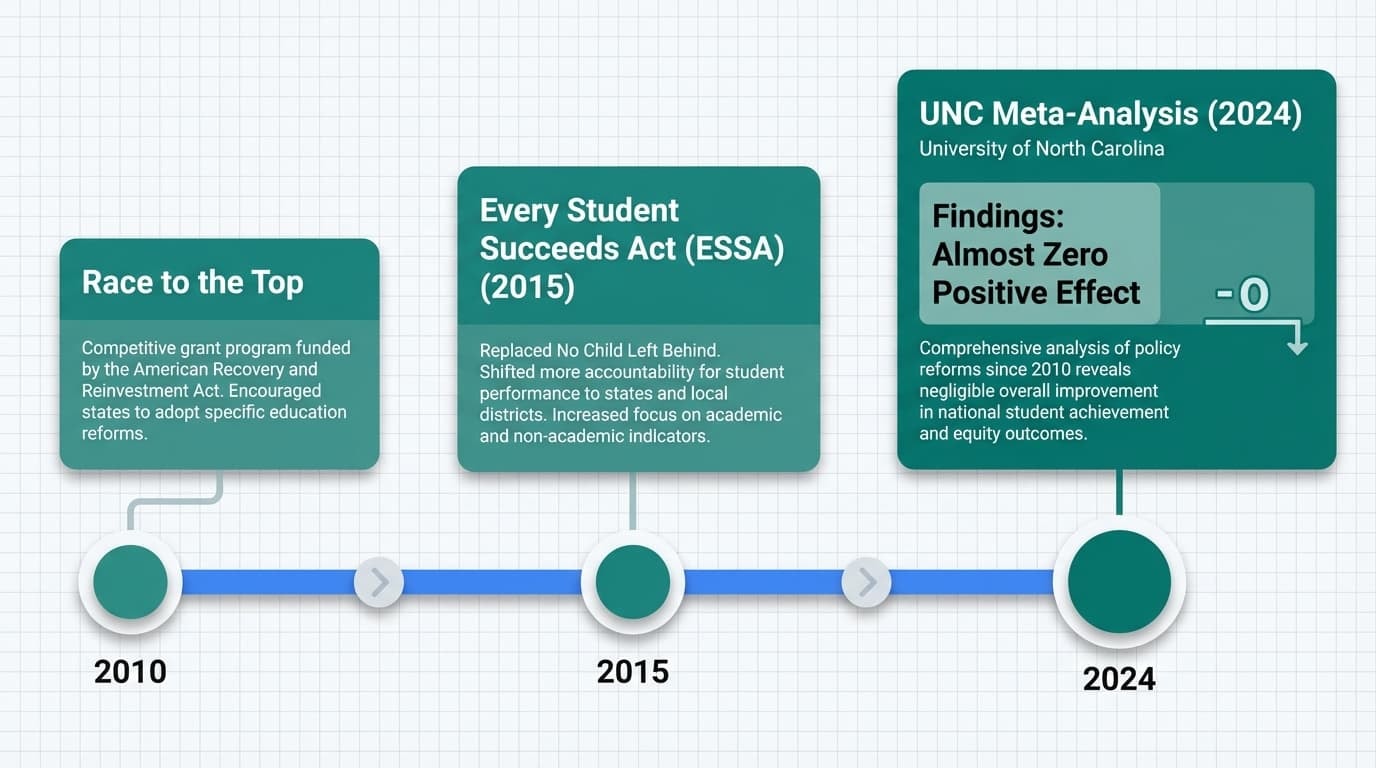
Federal reforms between 2010 and 2024, such as Race to the Top and the Every Student Succeeds Act (ESSA), mandated high-frequency evaluations to drive school improvement.
However, a 2024 UNC Meta-Analysis of 45+ states found that while these policies increased observation counts, they yielded almost zero positive effect on national student outcomes.
This disconnect indicates that federal policy prioritized the quantity of data over the qualitative instructional coaching necessary for school turnaround.
Between 2010 and 2024, major policy changes hit schools hard. Race to the Top grants pushed for tough teacher evaluation systems. The Every Student Succeeds Act (2015) kept the pressure on. Schools labeled as failing had to act fast or else.
The Wallace Foundation backed the idea of strong leadership driving change. The thinking was simple: more observations meant better teaching. So districts pushed weekly visits into school improvement plans. Elementary, middle, and high schools all followed the same playbook.
But that approach skipped over six things that actually matter:
- Principal capacity to lead well
- Feedback quality that teachers can use
- Teacher buy-in and trust in the process
- Enough instructional time in the classroom
- Curriculum alignment across grade levels
- The unique needs of each school’s kids and families
Turnaround got treated like a one-size-fits-all fix. It wasn’t.
Does Increased Observation Frequency Improve Student Achievement?
The data on observation frequency is clear and a little uncomfortable.
More visits might make ratings more reliable. But they don’t move student learning forward on their own.
The Tennessee Study: Key Findings That Changed the Conversation
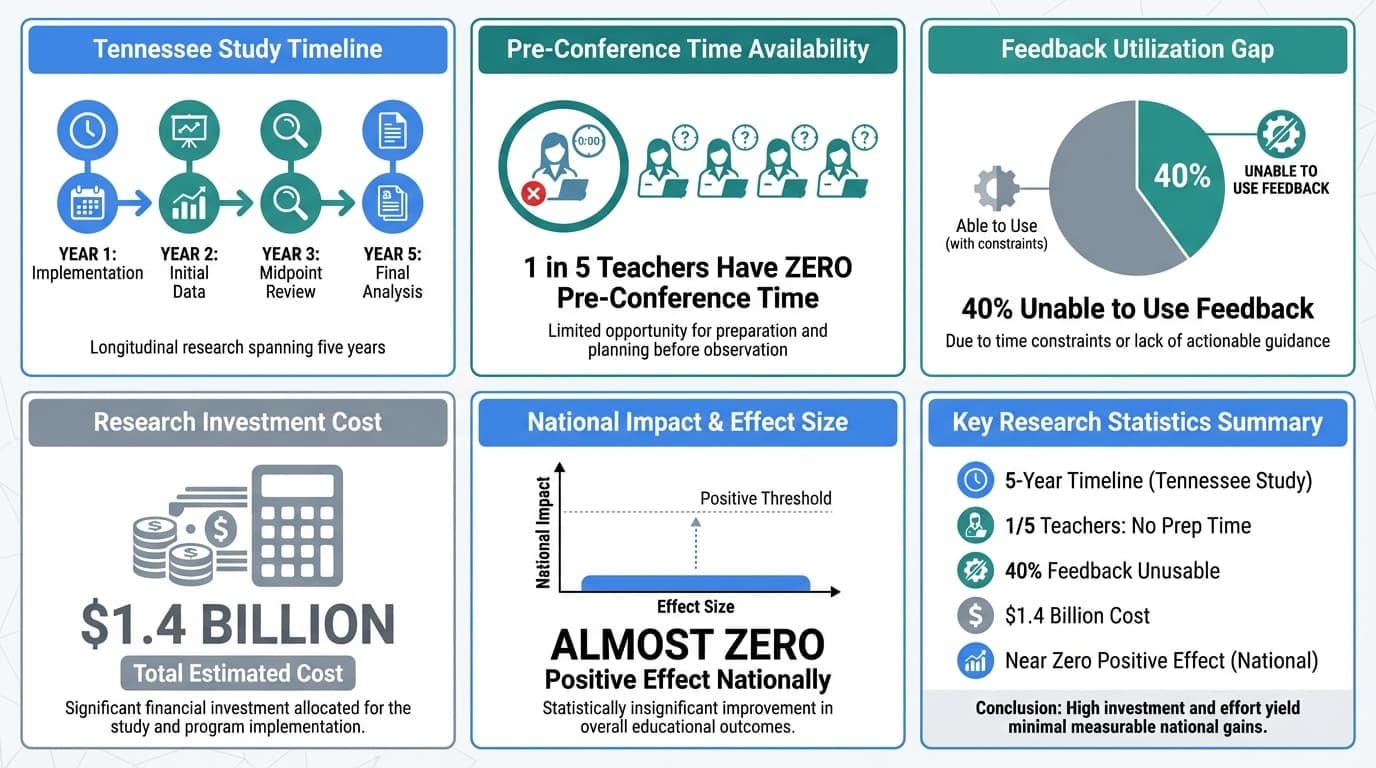
Vanderbilt researchers studied all Tennessee teachers from 2011 to 2017. Their findings were hard to ignore. Adding one more formal observation per year did nothing for student achievement.
The study also showed why visits alone don’t work. Nearly 1 in 5 teachers got zero pre-observation conference time. About 40% said they couldn’t use the feedback they received. And many teachers never addressed the weak spots observers flagged.
The problem wasn’t how often teachers got observed. It was that the observations lacked depth and follow-through.
The University of North Carolina Meta-Analysis: A National Picture
A review of teacher evaluation reforms across 45+ states found something striking. Despite billions spent since 2010, student outcomes barely moved. More observations had “almost zero positive effect” nationally.
A few cities showed gains — Washington, D.C., Chicago, Denver, and Nashville. But those wins came from better feedback and a stronger curriculum. Not from doing more walkthroughs.
The lesson is simple: coaching quality and follow-through are what move the needle. Frequency without those things is just noise.
The Brookings Institution Analysis: The Cost of Compliance
Economist Matthew Kraft put it plainly, “At a cost of about $1.4 billion, we’ve learned that nearly all teachers are effective. But we haven’t learned how to help them get better.”
Billions were spent. Ratings went up across the board. But actual teaching quality stayed mostly flat.
Schools ended up with more paperwork and less time for the things that matter. That means less time for good instruction, curriculum work, and real relationships with kids and families.
Why Weekly Observations Break Down in Turnaround Contexts
Turnaround schools are already under pressure from every direction.
Staffing is shaky. Admin teams are stretched thin. The district or state is watching everyone. Piling on weekly observation requirements in that environment is a recipe for burnout.
Principal Time Constraints and Leadership Capacity
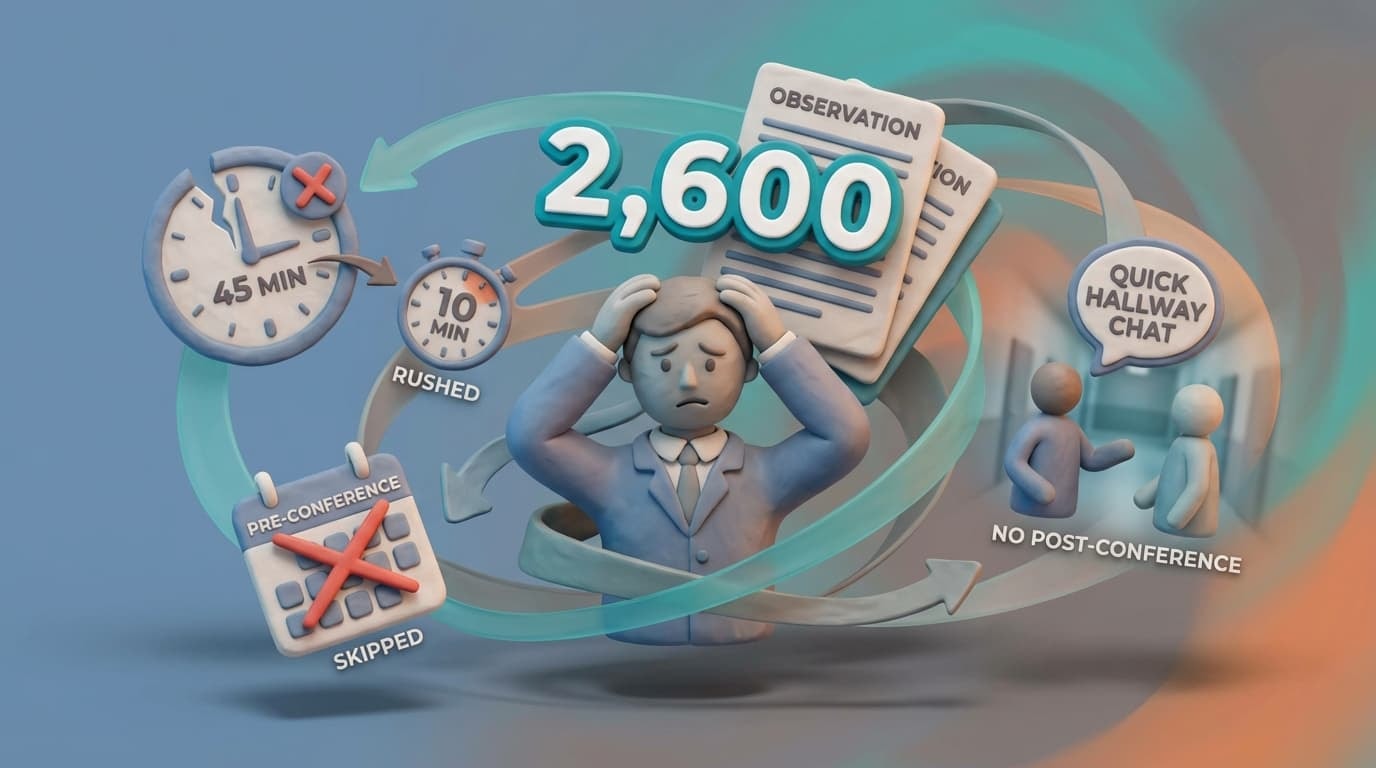
Here’s a quick math problem. A school with 50 teachers doing weekly visits means over 2,600 observations a year. That’s an enormous time commitment for any principal.
But principals in turnaround schools already have full plates. They’re managing crises, dealing with state monitors, and trying to keep teachers from leaving. When observations eat up that much time, something else has to give. Usually, it’s the deeper instructional work that actually helps kids.
A new principal in a failing school has an especially hard road. They need to earn trust, stabilize culture, and show quick wins. All at the same time. Adding thousands of hours of observation duties makes that nearly impossible to pull off.
At Education Walkthrough, we designed our platform to make observations faster and smarter. Principals can do more with less time and still get the data they need.
Implementation Fidelity Collapse: When Quality Disappears
A good observation cycle has three parts. A pre-conference, a full lesson observation, and a post-conference with real feedback. In theory, that’s the model. In practice, it rarely happens in turnaround schools.
Pre-conferences get skipped because there’s no time. Post-conferences turn into a quick hallway chat. Observations shrink from 45 minutes to 10 minutes of rushing through classrooms.
The result? Teachers get vague, rushed feedback they can’t act on. “Increase engagement” doesn’t help a 5th-grade math teacher fix tomorrow’s lesson.
This isn’t a teacher problem. It’s a system problem. The design sets everyone up to fail.
Evaluation Fatigue and Compliance Mindset
Constant unannounced visits feel like surveillance, not support. Teachers in high-stress schools are already dealing with a lot. Adding a weekly watchful eye breaks down trust fast.
The teachers who choose to work in tough schools are often the most motivated. But even they hit a wall when the system treats them like problems to manage instead of professionals to grow.
Again, the Wallace Foundation is clear on this: school culture is a cornerstone of turnaround success. When observations damage that culture, they’re working against the very goal they’re supposed to serve.
The Core Design Flaw: Frequency Without Feedback Quality
The real problem isn’t how often observations happen.
The problem is that most observation cycles are missing the parts that actually help teachers improve.
What High-Quality Observation Cycles Should Include
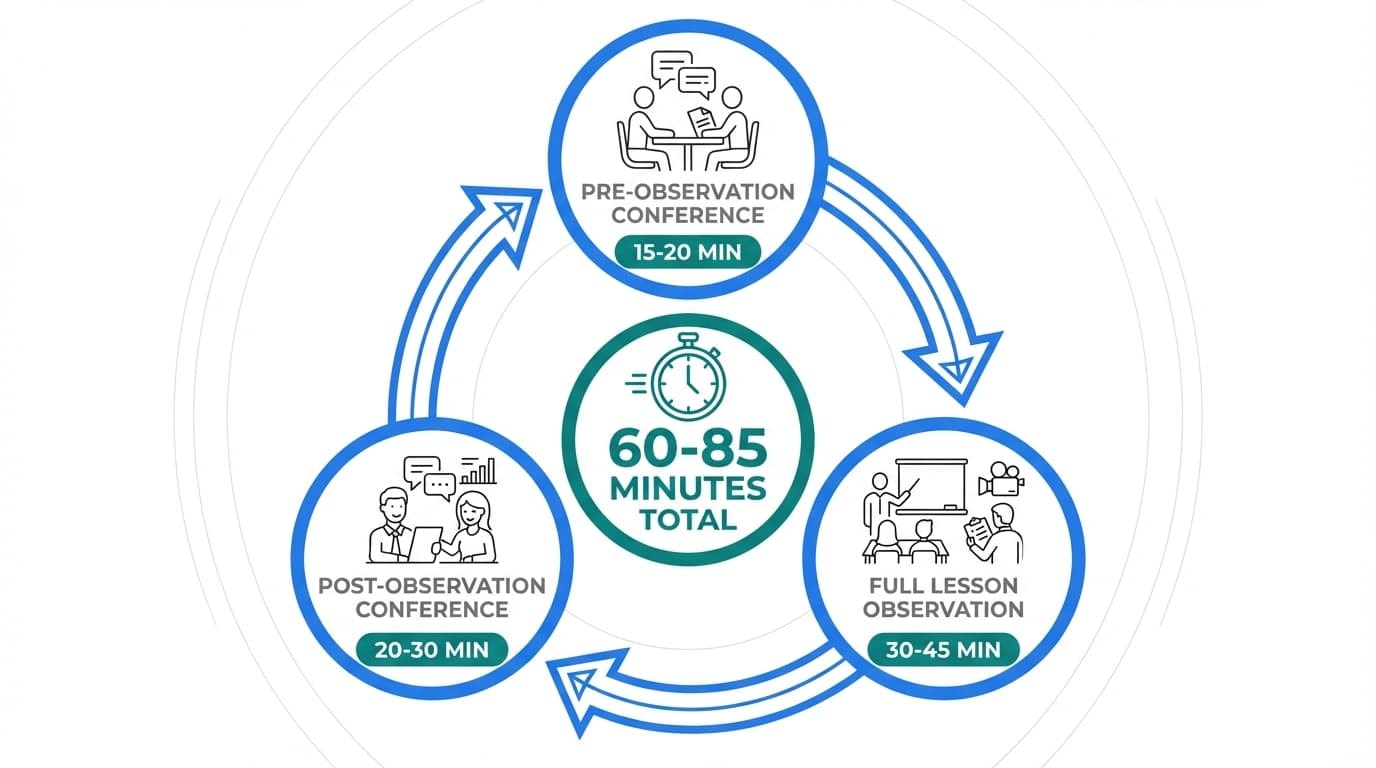
A strong observation cycle has three parts. Each one matters.
- Pre-observation conference (15–20 min): The observer and teacher talk through the lesson together. They look at recent student data and pick a specific focus. The teacher shares what success looks like for that class.
- Full lesson observation (30–45 min): The observer watches the whole lesson from start to finish. They take specific notes tied to the pre-agreed focus. They look at what students are doing, not just what the teacher is saying.
- Post-observation conference (20–30 min): The observer shares what they saw with real examples. They ask questions that help the teacher reflect. Together, they land on one clear, doable next step — like “try cold-calling during text discussions in Grade 8 instead of choral responses.”
This takes about 60–85 minutes total. But it produces feedback that teachers can actually use the next day.
What Actually Happens in Turnaround Schools
In reality, most turnaround schools skip the conferences entirely. Generic checklists replace thoughtful notes. Feedback arrives days later via email… if it arrives at all.
That’s why so many teachers never act on what observers flag. It’s not because they don’t care. It’s because the feedback isn’t specific or timely enough to be useful.
Counting observations doesn’t tell you if teaching got better. It just tells you how many boxes got checked.
Real-World Success: How ASDB Transformed Observations
Quality beats frequency — and ASDB proves it.
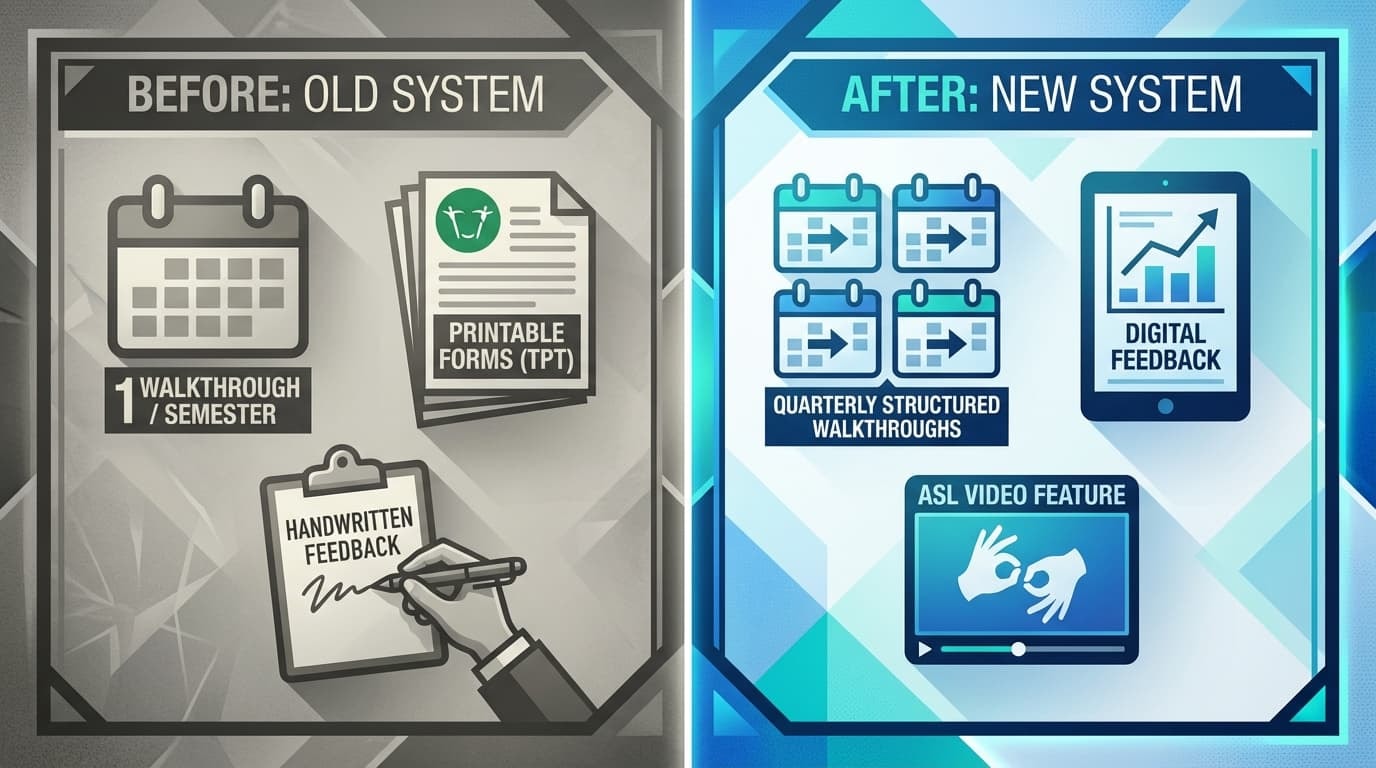
Before using Education Walkthrough, ASDB Assistant Principal Meghan Boyle was doing just one walkthrough per classroom per semester. She used printable forms from Teachers Pay Teachers. Feedback was handwritten. Strategic planning felt unclear. With 40 classrooms to support, consistency was nearly impossible.
After switching to Education Walkthrough, things changed fast. Not because Meghan started visiting every week, but because the quality and clarity of feedback went up significantly. She now does at least one structured walkthrough per quarter, plus regular drop-ins. Teachers get digital feedback that’s timely, specific, and tied to real goals.
Using platform data, Meghan spotted that the classroom environment was a weak spot across multiple classrooms. That single insight shaped a new school-wide strategy and led to real improvement.
Teachers at ASDB feel more supported now. “The teachers really appreciate the feedback,” Meghan says. “The digital PDF helps them stay on track with their goals.” And administrators are being held more accountable, too — the data shows exactly how many walkthroughs are happening and when.
For ASDB’s deaf and hard-of-hearing staff, Education Walkthrough’s video feature was a game-changer. Feedback could be delivered in American Sign Language directly through the platform. That kind of built-in accessibility made the tool a clear winner for their team.
The ASDB story is a great example of what’s possible when schools focus on building the right system instead of just doing more walkthroughs.
Better Alternatives: What Actually Supports Turnaround-Level Improvement
There are better ways to improve instruction than more admin walkthroughs.
Schools that actually turn around invest in coaching, peer learning, and teacher collaboration. Not in watching teachers more often.
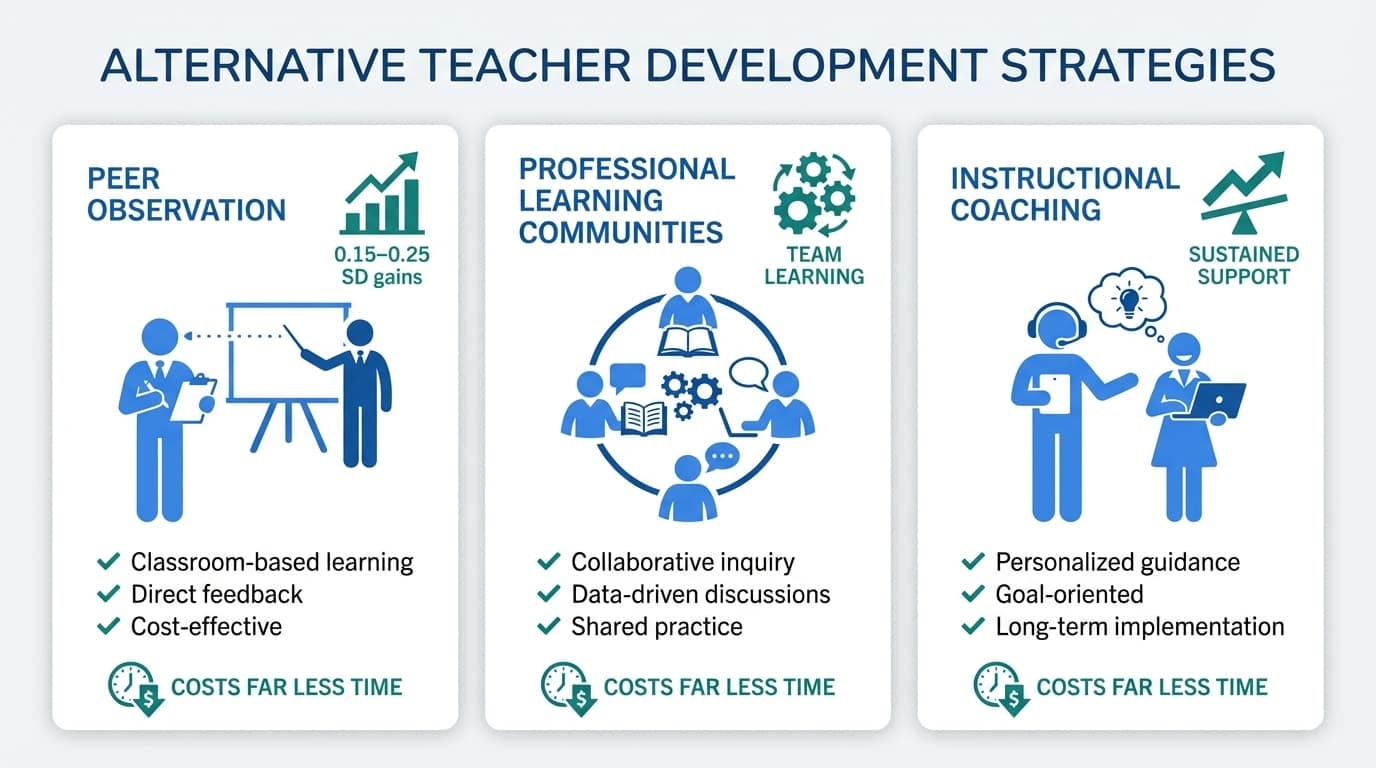
Peer Observation Approaches That Build Teacher Capacity
Teachers observing each other is one of the most underused strategies in education. When a fourth-grade reading teacher watches a colleague teach, they see things no administrator can. They know the texts, the kids, and the challenges firsthand.
Research backs this up. Peer observation is linked to student achievement gains of 0.15–0.25 standard deviations. That’s meaningful. And it costs far less time than weekly admin walkthroughs.
It also builds trust and shared language among teachers. When educators learn from each other regularly, school culture gets stronger. That culture is what makes improvement stick.
Professional Learning Communities as Observation Infrastructure
Observations work much better when they’re connected to team learning. A PLC that meets weekly to look at student work and data creates the perfect home for observation and feedback.
Say a 4th-grade team uses running records to spot kids struggling with inference. Peer observations within the PLC then focus on exactly that — what instructional moves help kids draw inferences? What works?
When a teacher gets feedback from an observation, the next PLC meeting is where they talk about how it went. That quick feedback loop — try, observe, discuss, adjust — is how real improvement happens. Weekly admin visits can’t replicate that rhythm.
Instructional Coaching That Combines Observation With Support
Coaching paired with lighter-touch admin observations is a smart combo. A coach can go deep with one or two teachers each week. They model strategies, co-teach, observe, and debrief — all tied to real classroom content.
A math coach working with a struggling teacher might watch a fractions lesson. Then model a better approach the next day. Then co-teach a follow-up lesson. Then debrief together. That’s the kind of specific, sustained support that changes practice.
The Wallace Foundation has invested heavily in instructional coaching for good reason. It gets results. And it costs less — in time and dollars — than overloaded observation systems.
Redesigning Weekly Observations So They Don’t Fail
Some schools are locked into weekly observations by state plans through 2026.
That doesn’t mean they’re stuck with a broken system. Here’s how to redesign weekly observations so they actually help.
Adopt a “Less Is More” Focus for Each Visit
Pick one thing to look for each visit, not the whole rubric. In October, all 8th-grade ELA observations might focus on just one question: Are students doing the thinking, or is the teacher doing it for them?
That narrow focus makes feedback specific and useful. Trying to score everything at once makes feedback generic and overwhelming.
Let student data and school improvement priorities guide the focus of each month. Involve teachers in picking those focus areas, too.
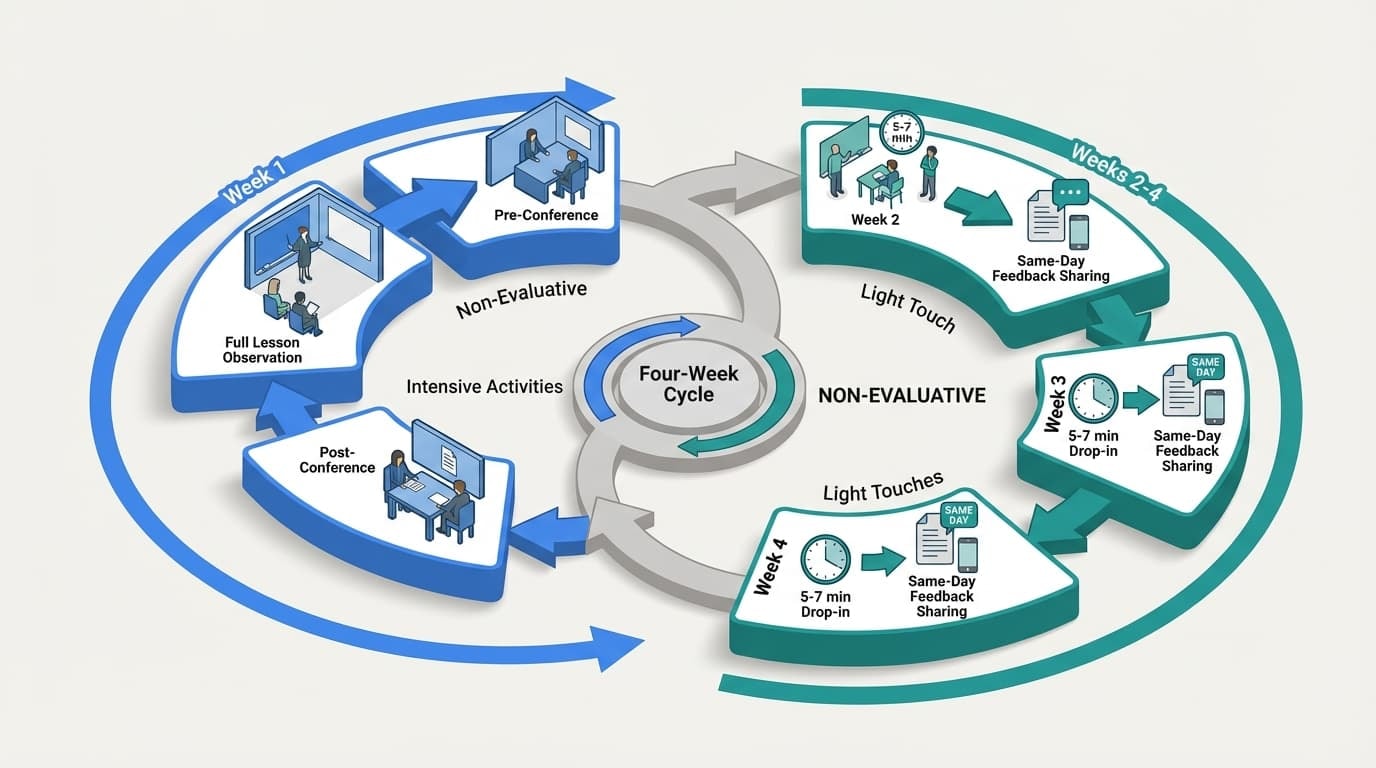
Build a Predictable Observation Cycle
Give teachers a clear rhythm, so observations feel like support, not surprises.
Week 1: A full lesson observation with a pre-conference and a post-conference. Tied to the teacher’s quarterly growth goal.
Weeks 2–4: Short drop-ins of 5–7 minutes, focused on the same thing from Week 1. These are non-evaluative — just quick notes shared the same day.
This approach keeps principals visible without burning anyone out.
Center Teacher Voice in Setting Observation Focus Areas
Let teachers co-set their observation focus at the start of each grading period. Based on their own student data, they choose one area they want to improve.
That changes everything. Teachers stop dreading observations and start using them. They know what’s being looked for because they helped choose it.
School leaders should track each teacher’s quarterly focus so that every observer is on the same page.
Connect Observations to Data-Driven Instruction Routines
Plug observation data into PLC meetings every 1–2 weeks. Pair walkthrough trends with benchmark assessment results. Look for patterns together and respond quickly.
When observation data lives in a shared dashboard, leaders can spot trends across classrooms. If five teachers all struggle with the same thing, that’s a school-wide PD opportunity — not five separate coaching issues.
Education Walkthrough makes this easy. Observation notes, timestamps, and trends are all in one place.
Guardrails for Using Observations in School Improvement Plans
Districts updating turnaround plans for 2025–2028 need smart boundaries around observations.
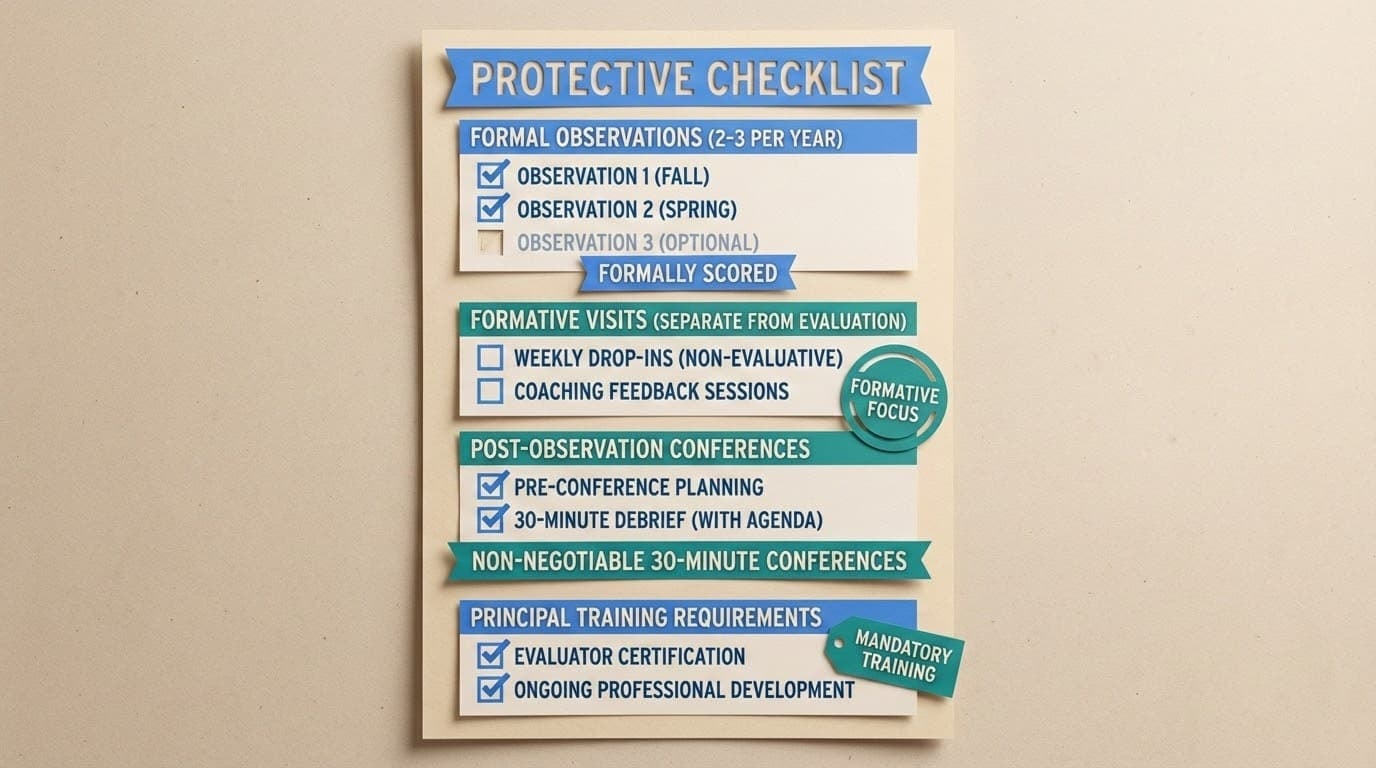
Cap Formal Observations and Protect Formative Visits
Set a cap of 2–3 formally scored observations per teacher per year. Weekly drop-ins should be labeled formative and kept completely separate from evaluation scores or job decisions.
That separation is what keeps teachers open to feedback. When every visit feels high-stakes, people stop taking risks.
Require Conferencing Time
Make pre- and post-conferences non-negotiable for every formal observation. Block the time on the calendar. Give post-conferences at least 30 minutes with a clear agenda.
Plans that require more observations without protecting time for conferences will always fall apart.
Train Principals on How to Give Better Feedback
Invest in principal training before adding more observations to anyone’s plate. Run annual calibration sessions using real classroom videos. Ensure all observers score consistently.
This matters even more when coaches and assistant principals are also doing observations.
Use Observations to Support Teacher Retention
Don’t let observation data just sit in a spreadsheet. Use it to figure out where teachers need extra support or relief. Hard-to-staff roles like special education and bilingual classrooms deserve special attention.
Teachers leave when they feel unsupported. A good observation system should make them feel seen, valued, and growing, not watched and judged.
Conclusion: From Surveillance to Support
The evidence is clear: more observations without better feedback don’t work.
Schools have spent over a billion dollars on observation systems that produced almost no gains in student learning. The missing piece was never frequency. It was the quality of feedback, the depth of coaching, and the strength of the culture around professional growth.
The turnaround schools that actually improve are the ones that invest in people. They build strong teacher teams, use coaching strategically, and create systems that allow feedback lead to real change in the classroom.
Education Walkthrough is built for exactly that. It helps school leaders conduct fewer, better observations and turn every visit into something teachers actually value.
Frequently Asked Questions
Here are answers to the most common questions schools ask about observation frequency, coaching, and what actually works in turnaround settings.
Are weekly observations ever appropriate in a turnaround school?
They can work under the right conditions. The school needs strong observer training, clear teaching standards, and protected time for real post-conferences. Visits should be short and focused on one thing at a time — not full rubric scoring. And they must be kept separate from formal evaluation so teachers can relax and grow.
How many observations per year actually improve teaching?
Research suggests 2–3 well-run formal observations per year outperform 30+ rushed ones. Each one needs a pre-conference, a full lesson, and a meaningful debrief with specific feedback. Pair those with regular coaching visits and PLC meetings, and you’ve got a system that works.
What’s the difference between a walkthrough and a full observation cycle?
A walkthrough is a short, informal visit — usually 5–10 minutes. It gives a quick snapshot of what’s happening in the room. A full observation cycle includes a planning conversation beforehand, a 30–45-minute lesson observation, and a 20–30-minute debrief afterward. The debrief is where the real growth happens.
How do you keep observations from hurting teacher morale?
Start by giving teachers a say in what gets observed. Keep most visits non-evaluative. Always share what the teacher is doing well, not just what needs work. And limit the number of rubric items scored in a single visit. When teachers feel like observations are for them — not about them — everything shifts.
What should districts track to know if their observation system is working?
Watch both process and outcome data. Process metrics include whether conferences are happening, how quickly feedback is delivered, and what teachers think of the quality of the feedback. Outcome metrics include whether teaching practices are actually changing, whether teachers are staying, and whether student results in reading and math are improving over time.